The Story
Intro
Nodes is a JavaScript-based 2D canvas for computational thinking. It’s powered by web technologies and the npm ecosystem. We take inspiration from popular node-based tools but strive to bring the visual interface and textual code closer together while also encouraging patterns that aid the programmer in the prototype and exploratory stage of their process.
Nodes was created and developed by Nick Nikolov, Marcin Ignac and Damien Seguin since 2017 inside Variable. Even as the very nature of the tool is to experiment and explore new ways to play with code and data, Nodes has been used in several production-grade projects and tested in various real-world scenarios. We have used it to create realtime 3D graphics installations, explore and visualise data, experiment with AI and export results in various formats like images for print, videos for social media, 3D models for mobile AR and data files for further processing.
On this page we are going to explain our motivations, the evolution and the current state of Nodes and how it changed our approach to creative coding.
Quick primer on visual programming
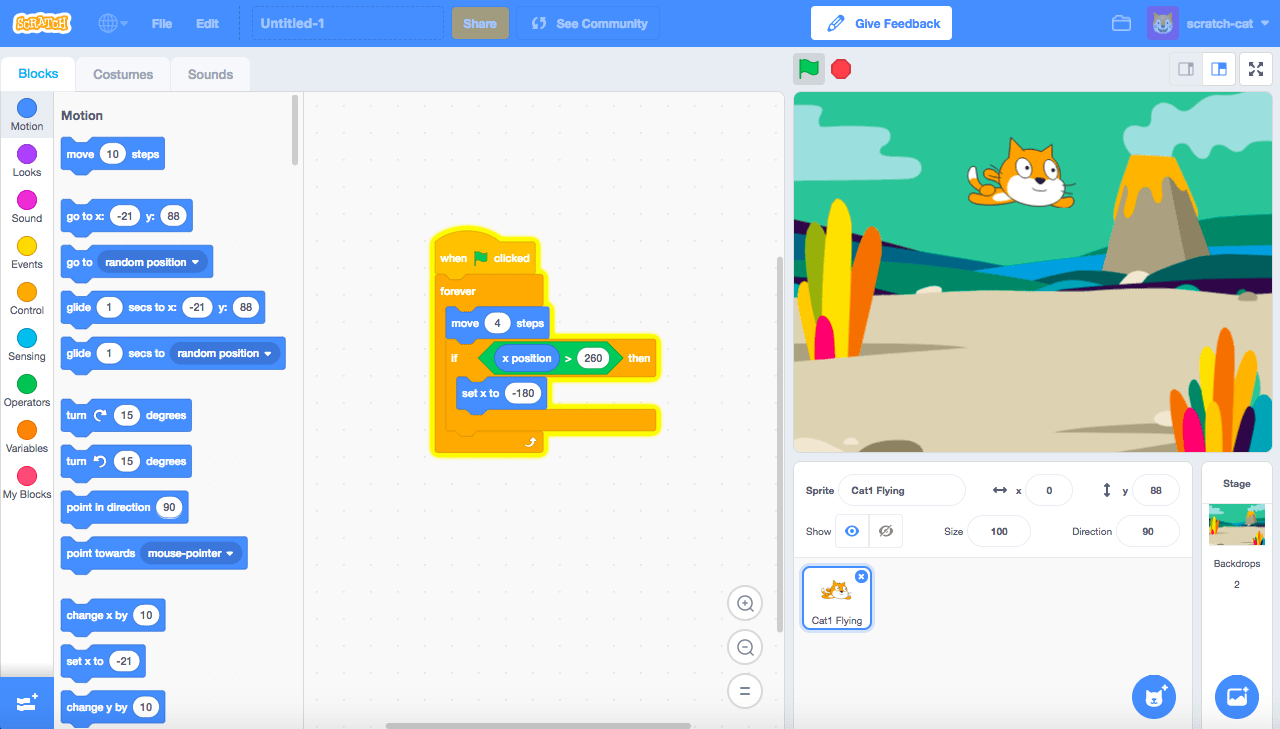
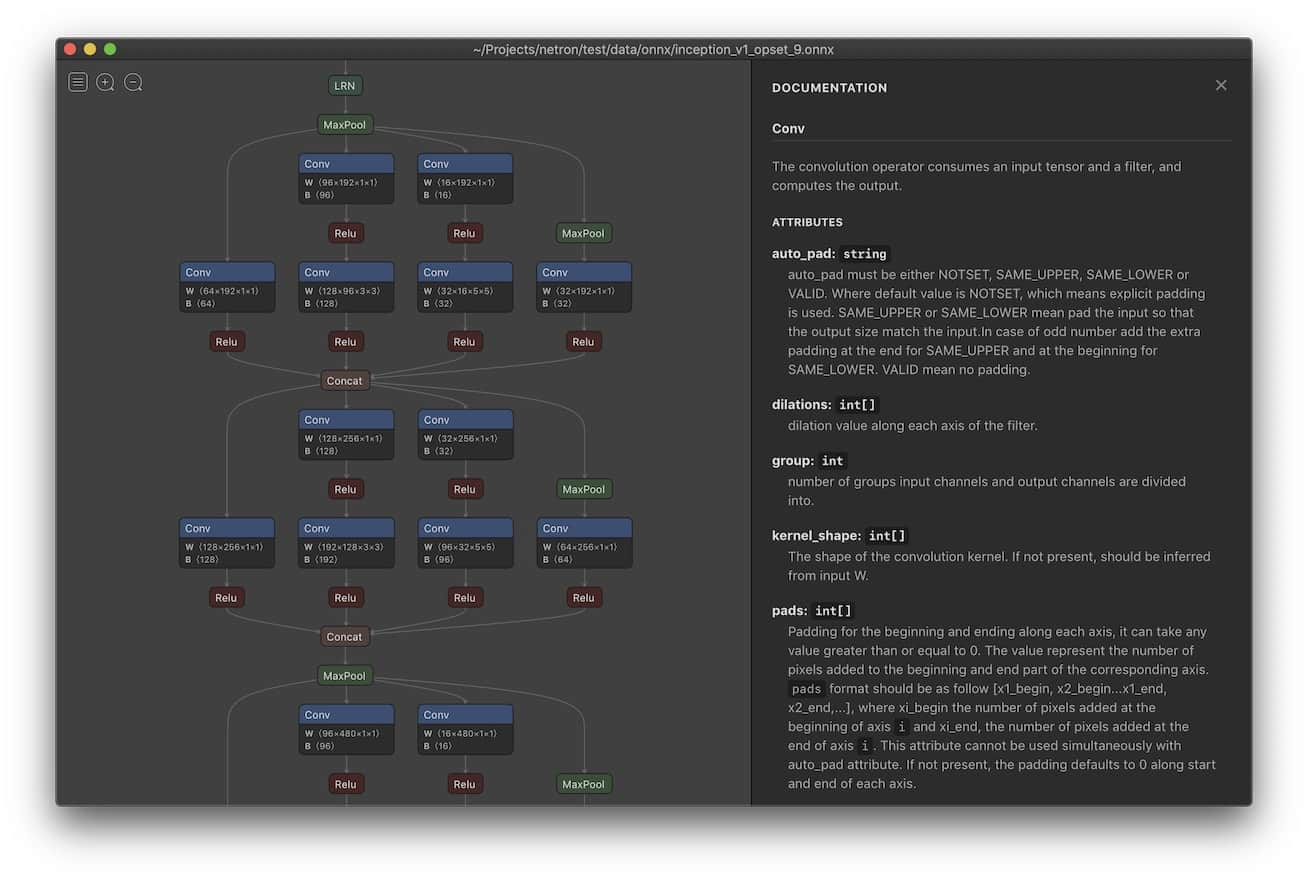
In some programming tools, the actual language is visual: instead of writing text you construct your program visually. Think Scratch, or a more modern take like Luna which technically has a dual nature, both visual and textual.
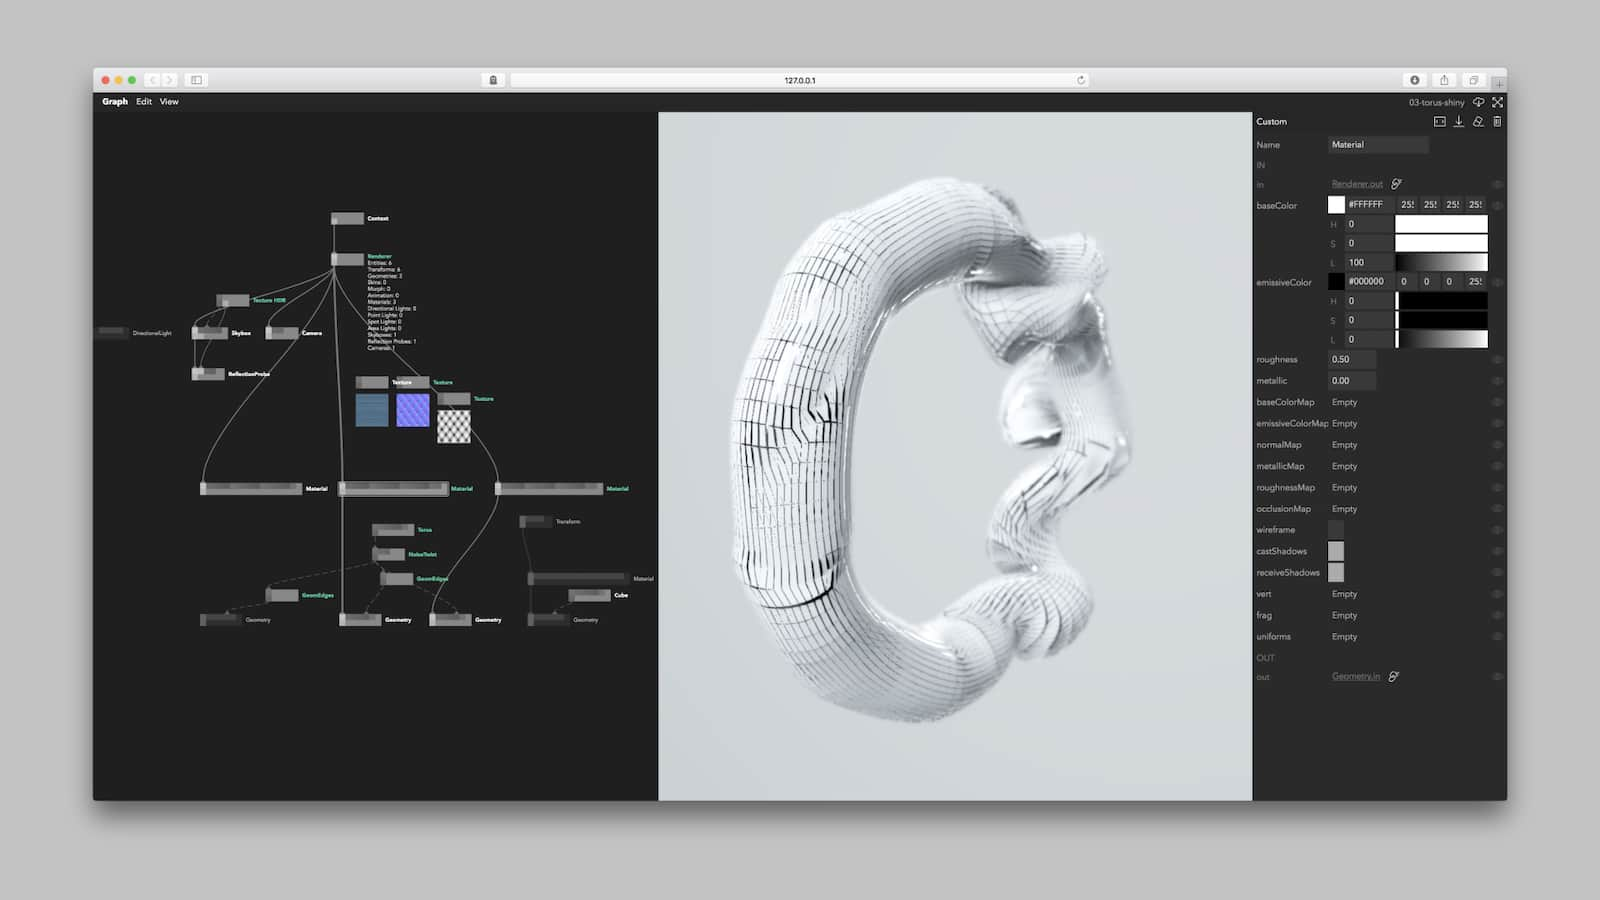
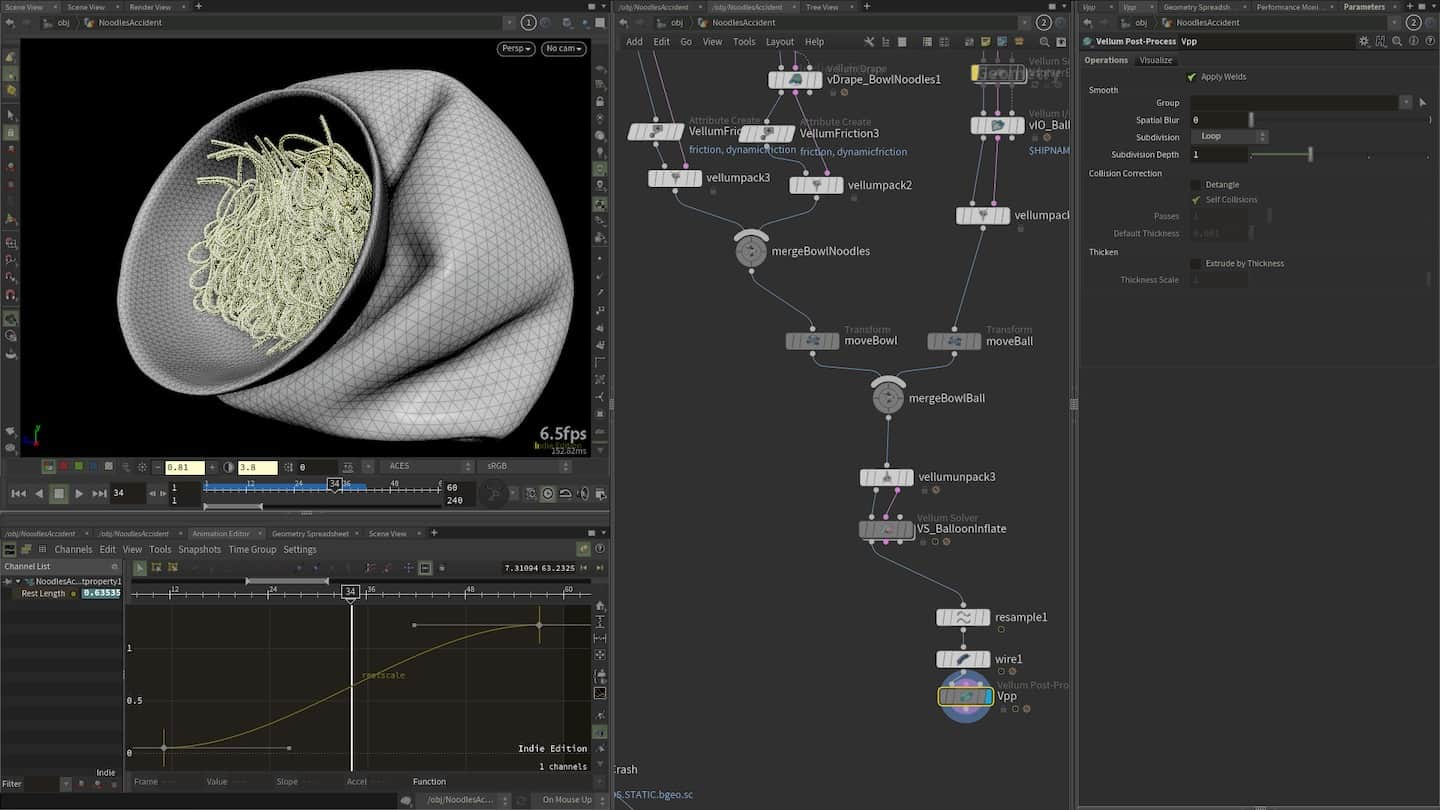
Most of the popular visual programming tools today use a visual interface as an abstraction just one level above textual code. Instead of files, you have 2D representations of your program, very often in the form of rectangular shapes connected by wires. Much like similarities in programming language syntaxes (use of for loops and class constructs), visual tools tend to be rectangles wired up together representing data flows. This makes them very popular in areas like visual effects programming, real-time graphics, data-processing pipelines, procedural architecture and so on.
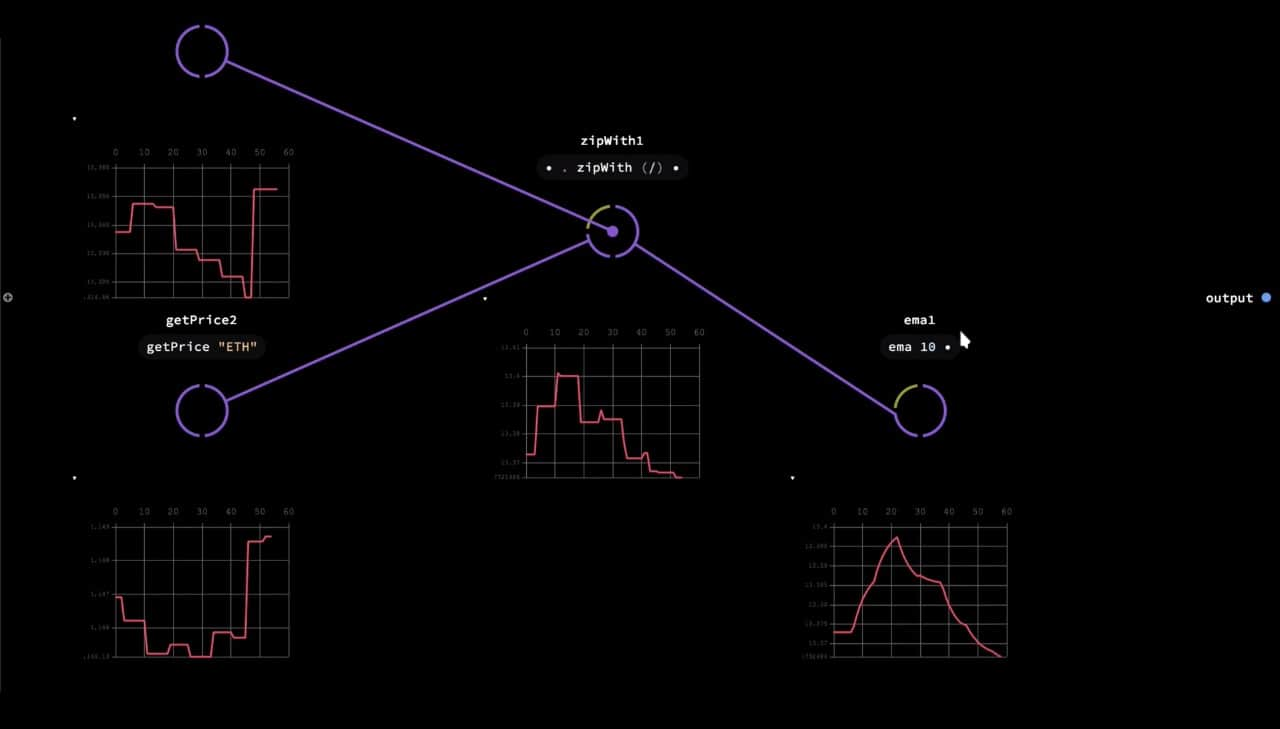
Artificial Intelligence is another area where computational graphs – such as Neural Networks – are likely to be visualised with nodes and wires.
Background
Motivations and inspirations
At Variable, our data visualisation and generative design studio, we are programmers first and foremost. But each of us has their own unique background be it in interaction and graphic design, real-time graphics, new media art, music production etc. What these fields have in common is that artists rely on professional-grade, typically very visual and sophisticated software-based tools. As our main medium of expression shifted to code, we’ve enjoyed unparalleled creative flexibility but at the same time we traded that for our ability to “see”.
Visual programming tools are as old as computer monitors. Serious web-based implementations however have been rare and impractical. Today, JavaScript and the npm ecosystem offer a wide variety of actively maintained open-source libraries for creative, visual, generative and data-driven projects. Furthermore, modern browsers provide an ubiquitous, networked, collaborative platform that is hard to match. Instead of creating another bespoke and isolated tool, we opted to extend and enhance an already existing and productive environment.
When we set off to create a tool of our own, there were already plenty of different node-based or visual scripting/programming tools and environments; VVVV, Houdini, TouchDesigner, Cables.gl, Vizor Patches, Lichen, MaxMSP, UE4 Blueprints and Origami were among the most popular. Since the genesis of Nodes, we have encountered even more: some old, some brand new like the latest Unity Visual Effects Graph. Looking at it this way, it’s hard to see why the world needed yet another one of those but when dissecting most of them in-depth, one quickly sees the limitations and various trade-offs each particular tool forces you to make. None in particular offers the JavaScript and npm-first, programmer heavy approach of Nodes.
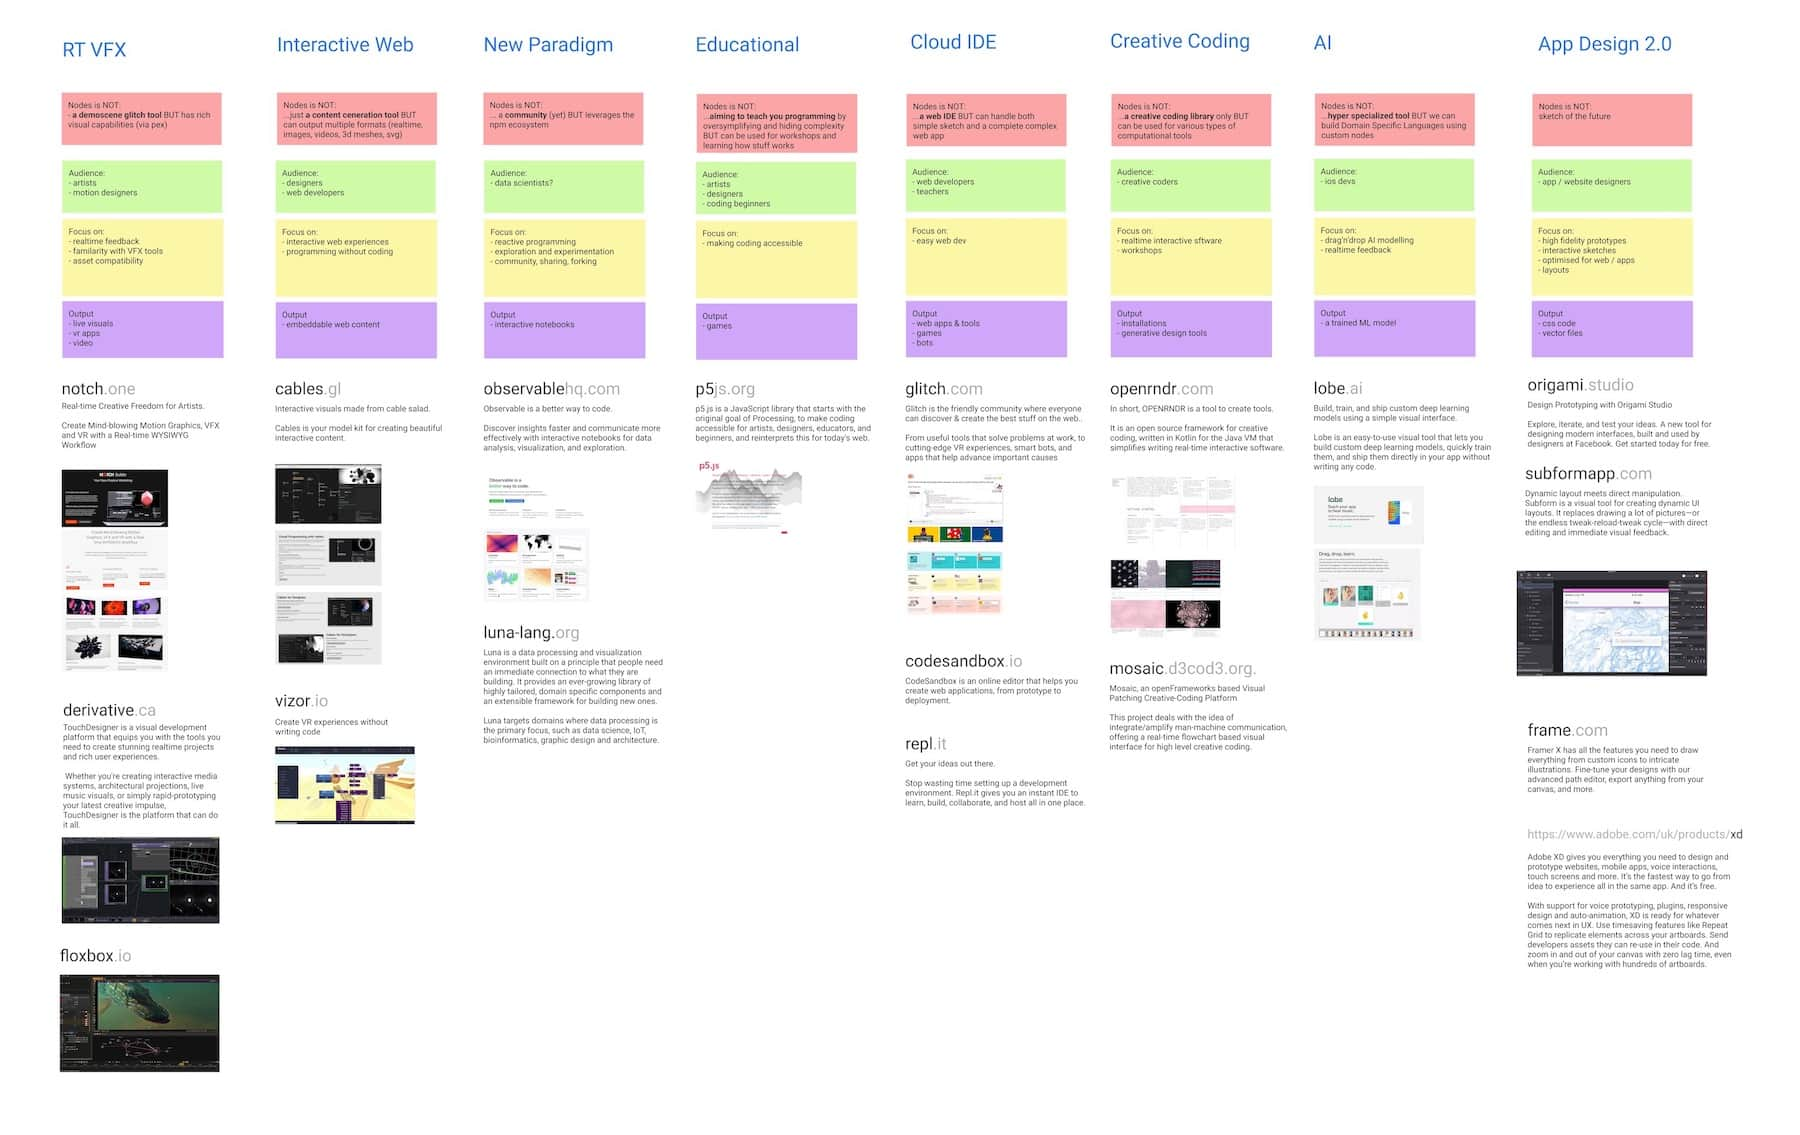
We made a provisional breakdown of the modern visual and web-based programming landscape in this Visual Tools Landscape Figma Board. You can see a high res version here: visual-tools-landscape.pdf.
Features
Version 1.0.0 beta has been released in the fall 2020.
You use Nodes by downloading the app. A cloud-based version for collaboration and client work was always one of our goals but isn’t a priority just yet. The benefit of running locally is that you maintain control over your data and don’t have to worry about assets sizes.
Node-based programming
In Nodes, you write programs by connecting “blocks” of code. Each node – as we refer to them – is a self contained piece of functionality like loading a file, rendering a 3D geometry or tracking the position of the mouse. The source code can be as big or as tiny as you like. We’ve seen some of ours ranging from 5 lines of code to the thousands. Conceptual/functional separation is usually more important.
You create a node by double clicking anywhere on the Graph Editor canvas and then choosing a node from a list of templates. Nodes can declare public properties called ports allowing them to receive and send data via connections. There are two types of ports:
- Trigger: expected to be updated every frame for realtime applications. We use those to define node hierarchy like render graph or UI widget tree. Because of their nature, we sometimes say they are “live”.
- Param: used to send data between nodes, updated only if their value changes. Examples might be: cube size, image url, material colour etc.
So what’s happening here?
- We start at the
Canvasnode: on requestAnimationFrame (ideally 60 times per second), the Canvas node is firing its triggerOut callback and passing a “props” object to child nodes (think how React is passing props to child components). In this case, the props contain a reference to a Canvas 2D drawing context. - That reference is used by the
Background Colornode to clear the background. It’s then passed further down to theBlendnode, enabling multiplicative blending. - Next, we split into two branches, each one receiving the same props on every frame via a trigger callback:
- The
Timenode tracks time passed and outputs that value to a port calledtime. - The
Rectanglenode draws a red rectangle whose width and height equal to itsradiusport. We additionally connectTime.timeout port toRectangle.rotationin order to animate it.
- The
Anatomy of a node
Each node is defined by its code. Declaring triggers or ports and then evaluating the node, updates the graph view of the node. It also populates the inspector with widgets reflecting the different port types.

- Incoming trigger - connection from parent node
- Outgoing trigger - connection to child nodes
- Incoming parameter - with type colour resulting in a colour picker widget in the inspector
- Importing a package from npm (has to be added to the project first)
- Trigger callback - this is usually called every frame
- Reading properties provided by the parent node
- Reading input parameter value
- Main node code - drawing a rectangle with a given colour
- Passing data further down to the child nodes
Graph Editing
The graph canvas is of unlimited size which allows you to organise your code spatially and navigate around by panning (space + drag) and zooming (mouse scroll) or search (/ + type), see Powerful Search section below.
You can select a node by clicking on it or select multiple nodes by Shift + Click or drawing selection rectangle around them. Nodes can be deleted by pressing Backspace, and duplicated using copy (Ctrl/Cmd+C) and paste (Ctrl/Cmd+V). We support copying and pasting nodes between different graphs and browser windows. As the copied node is simply a piece of JSON, you can even paste piece of graph into an e-mail or Slack message.
It’s also possible to Undo/Redo your modifications using the habitual Cmd/Ctrl+Z and Cmd/Ctrl+Shift+Z key combinations.
Built-in code editor
One common differentiation between visual programming tools is the level of abstraction they operate on. Some tools, like Origami, are meant to prototype interactions of user interfaces and not much more. Others, like Pure Data for instance, are meant to be very low-level and let users craft their own environments. Some, like UE4 Blueprints or the Unity Visual Effects Graph, are embedded and part of a larger system (e.g. a game engine environment).
Nodes is more directly comparable to Cables.gl, FlowHub or MaxMSP but there are less preconceptions on what you use it for. Unlike most of them, Nodes adopt a more programmer-first approach where the nodes themselves are generally a lot more high-level and users are encouraged to peek inside, copy, modify, and write their own. While you could drop on a lower level and express language-level semantics like if-checks and for-loops, or math concepts like add or multiply on a node level, we generally don’t feel it is a productive way to work and prefer to write logic in a textual programming language. This approach might feel conceptually familiar if you have used NoFlo before.
Whatever your preference, with the built-in code editor, we are able to fluently move between such levels of abstraction and create nodes that range from rounding up a number to a complicated particle system running on the GPU. Edge cases can be handled by simply copying a node and adding more code. Reusable components can be created by splitting big nodes into smaller ones. As long as we keep the corresponding types of input/output ports intact, this can be done live on a running graph without needing to reload the whole application. We focused on opening, modifying and seeing changes as straightforwardly and instantly as possible.
This brings us to the most powerful feature of the code editor: live eval. At any point in time while editing the code, you can evaluate it by pressing shift + enter. All ports already present in the node will have their values and connections preserved. If you make a mistake or typo, you can edit the code and compile again or roll back to the last saved version.
Changing code on the fly while the state and relationships are both persistent and dynamic can be very freeing. If we introduce far ranging and disruptive changes, all nodes with errors will be highlighted in the graph and are usually quick to find and fix. Nodes tries to preserve the last working state as much as possible giving the programmer a chance to fix all mistakes until everything runs smoothly again.
Powerful search
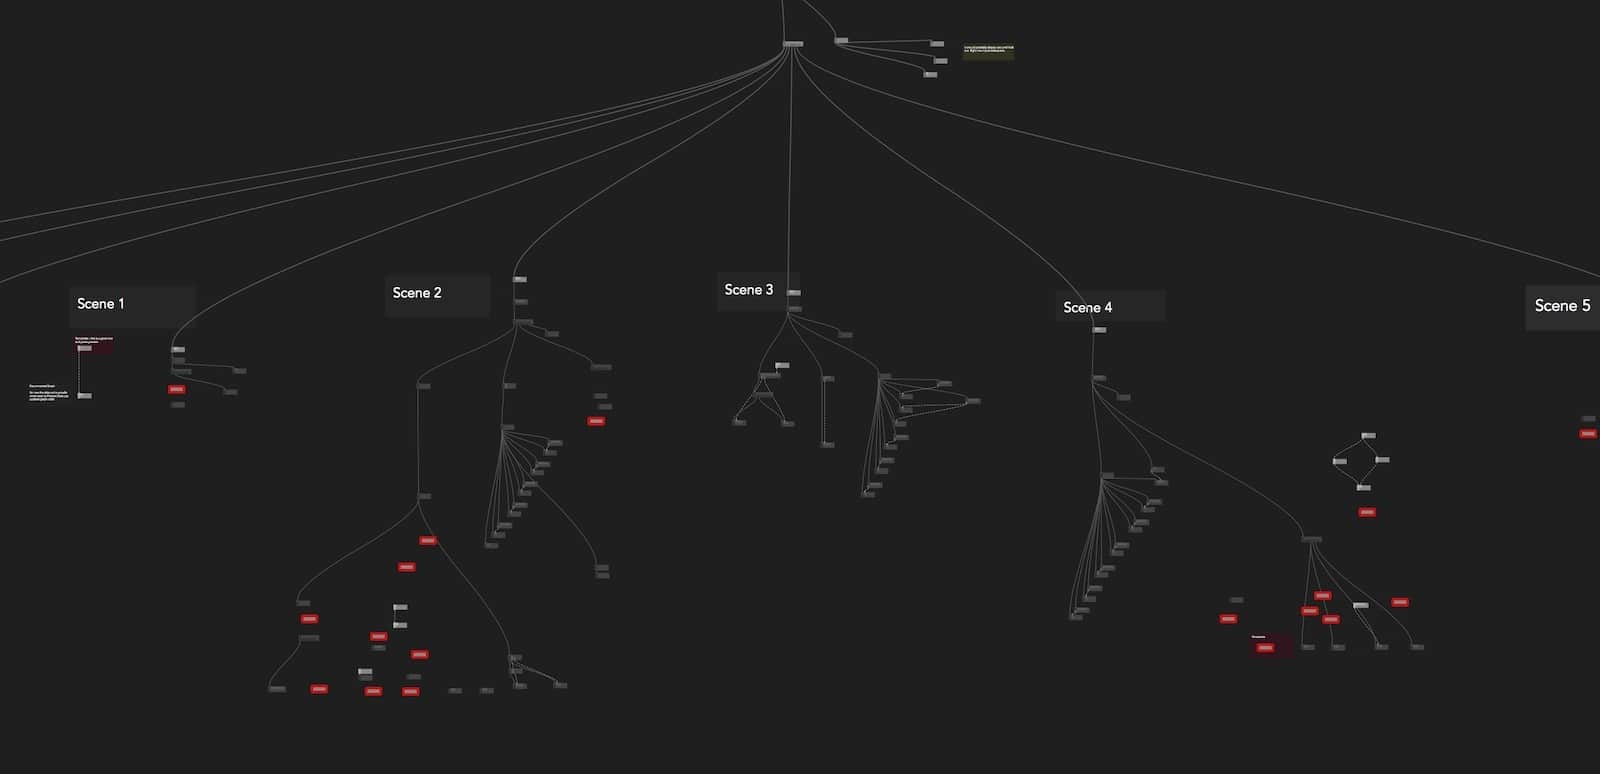
While an unlimited 2D canvas can be very helpful to think about the “bigger picture” and reason about the architecture of your app, zooming in and jumping around the codebase should be just as fast and fluid. To search the graph, you can simply press / and start typing. Use up/down arrows to jump between results and automatically focus on the given node. To search for actual node code, you can prefix your search query with ". For example, type "ctx.texture2D to find all nodes that call the ctx.texture2D function. You can then select a node using arrows and press enter to open code editor. The editor opens at the line of code that matched your query.
Graph State Visualisation
To help you better understand the internal flow of the application, we fade out nodes with trigger ports that haven’t been updated in the last frame. Similarly, the profiling mode visualises the CPU usage of each node. By colouring nodes by the amount of time the trigger took in the previous frame, we can identify hot paths of the graph that are worth optimising.
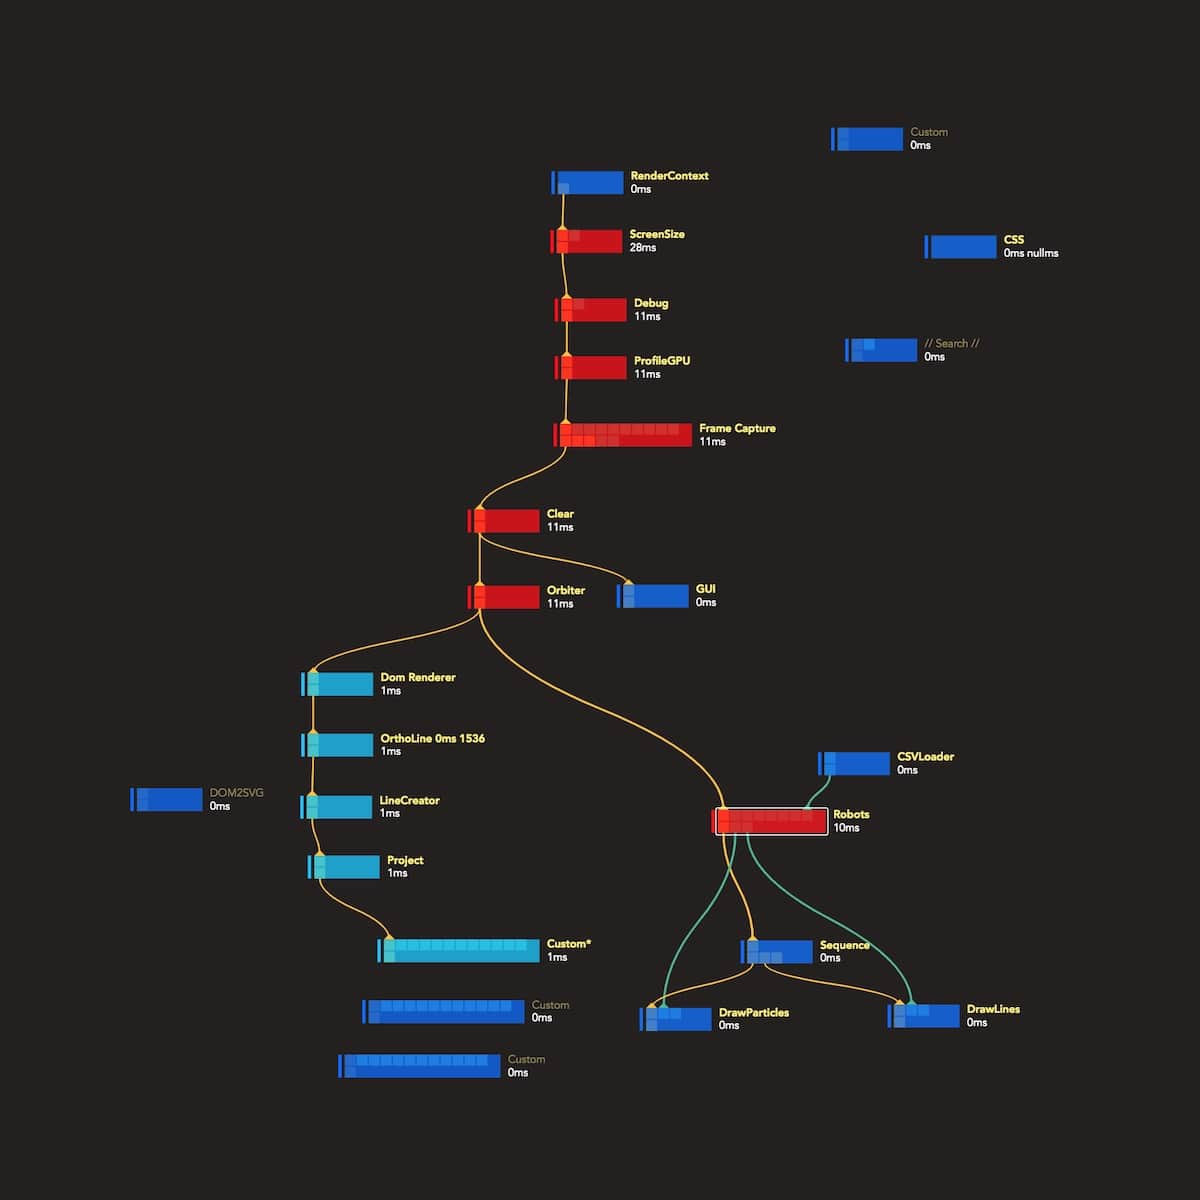
We think we are just scratching the surface here and other similar dynamic visualisations of the source code and the program logic can be very helpful in large projects.
Before Nodes, we would very often create custom “debug views” alongside the deliverable of our projects; it now happens right in the graph.
Static and dynamic node comments
Continuing that line of thinking, you can create a generic textual comment box using alt + left mouse click. We allow for some basic colour and font size options.
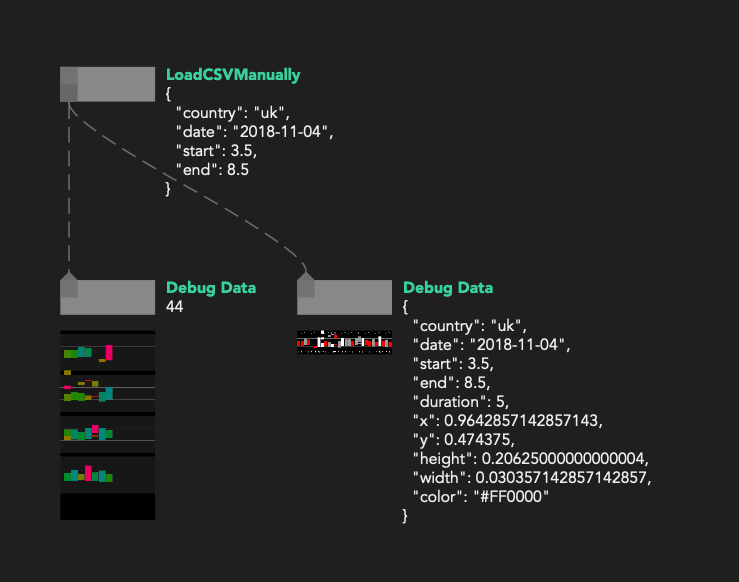
You also have access to dynamic comments by adding node.comment = 'my comment' inside a node’s code at any point. They appear below the name of the node in the Graph Editor view.
We use this feature to visualise various metadata: global state serialised JSON, loading statuses, timers, simple graphs… It allows for a basic but powerful and really fast way to “annotate” your source code and present whatever is the most important top-level information in your program.
Node comments can also display images, useful for example to display raw textures in big rendering graphs or even custom “drawings” using an image buffer. See more in Visual Literate Programming.
Export and publishing
From the very beginning, we wanted to be able to share prototypes with clients and collaborators. That’s where the export functionality comes in. In one click we bundle the JavaScript code, graph metadata and all the assets into an archive, ready to be hosted on a static web server or bundled as an Electron app. Additionally, the inspector allows you to “publish” a set of selected ports that are then available (although hidden by default) at runtime for tweaking and configuring the app.
This functionality allowed us to build tools for other designers, screen based installations and visualisations on the web or anything else that needs to be tweaked on the fly.
Technology
Core
- Frontend Framework: initially, choo (A 4kb framework for creating sturdy frontend applications) was chosen but we moved to a React UI layer to facilitates collaboration, improve performances and centralise app state.
- Bundler: in 2017, browserify was our first choice to bundle and manage npm dependencies but as the project grew, Webpack offered more functionalities, community support and reliability over time.
- Styling system: tachyons + custom CSS is used to style the UI easily without adding too much complexity
- 2D Graphics: a simple HTML Canvas is used to visualise the graph
- Text editor: monaco
User-space
The following are some of the most common modules that work well in such an environment and that we keep coming back to:
- PEX is an ecosystem of open source JavaScript modules developed in-house by Variable for building modern WebGL applications. The main modules are:
- pex-context - a low-level WebGL wrapper based on command and pipeline abstraction similar to Metal, Vulkan or WebGPU.
- pex-renderer - a Physically Based Renderer (PBR) and a scene graph similar to Three.js and Babylon.js.
The choice felt natural as both PEX and Nodes are developed at Variable. Having full control over the source code allowed us to improve many features of PEX that were needed for Nodes and vice versa. One downside here is that less examples and documentation are available compared to common frameworks such as Three.JS and that increased the learning curve for new Nodes users.
Other go-to packages are:
- @thi.ng/umbrella for functional programming & immutable state primitives
- D3.js for svg generation and data visualisation
- stack-gl for geometry processing
Use Cases
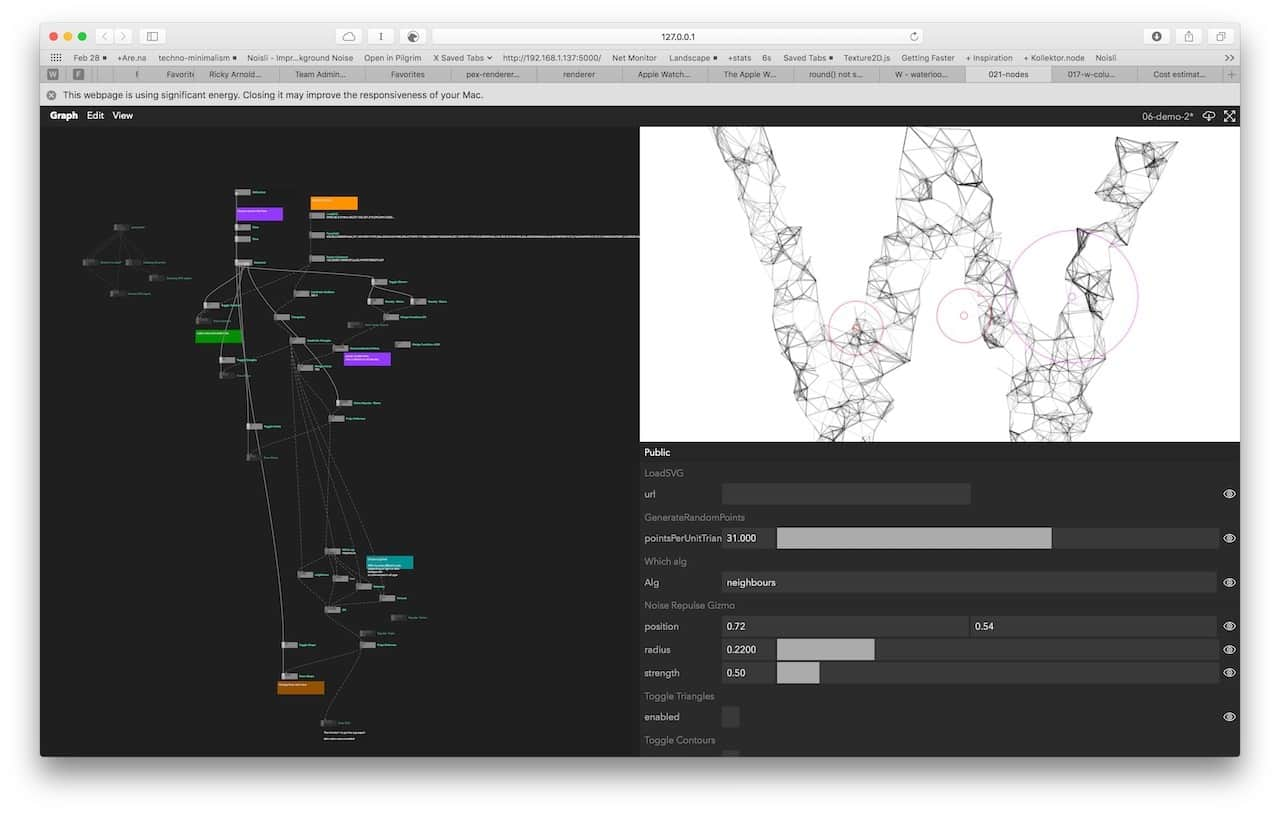
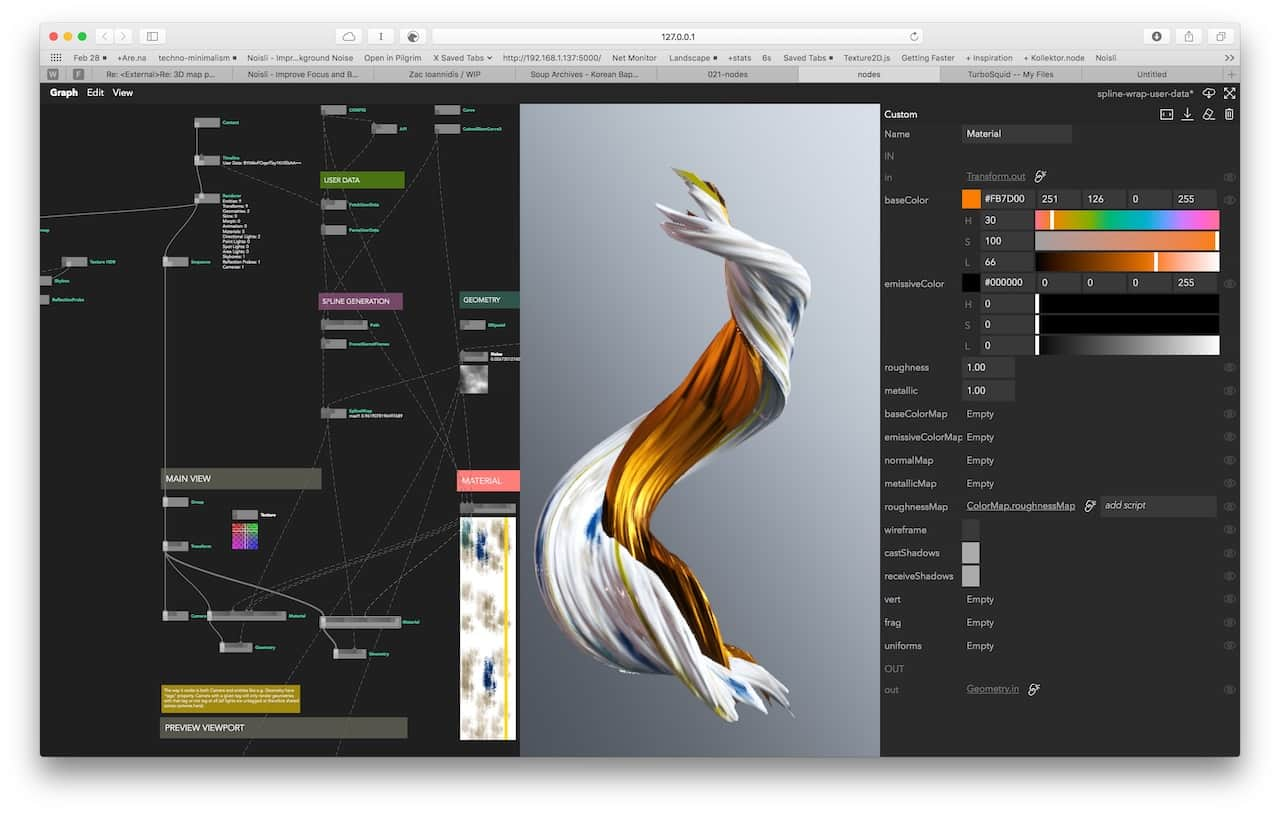
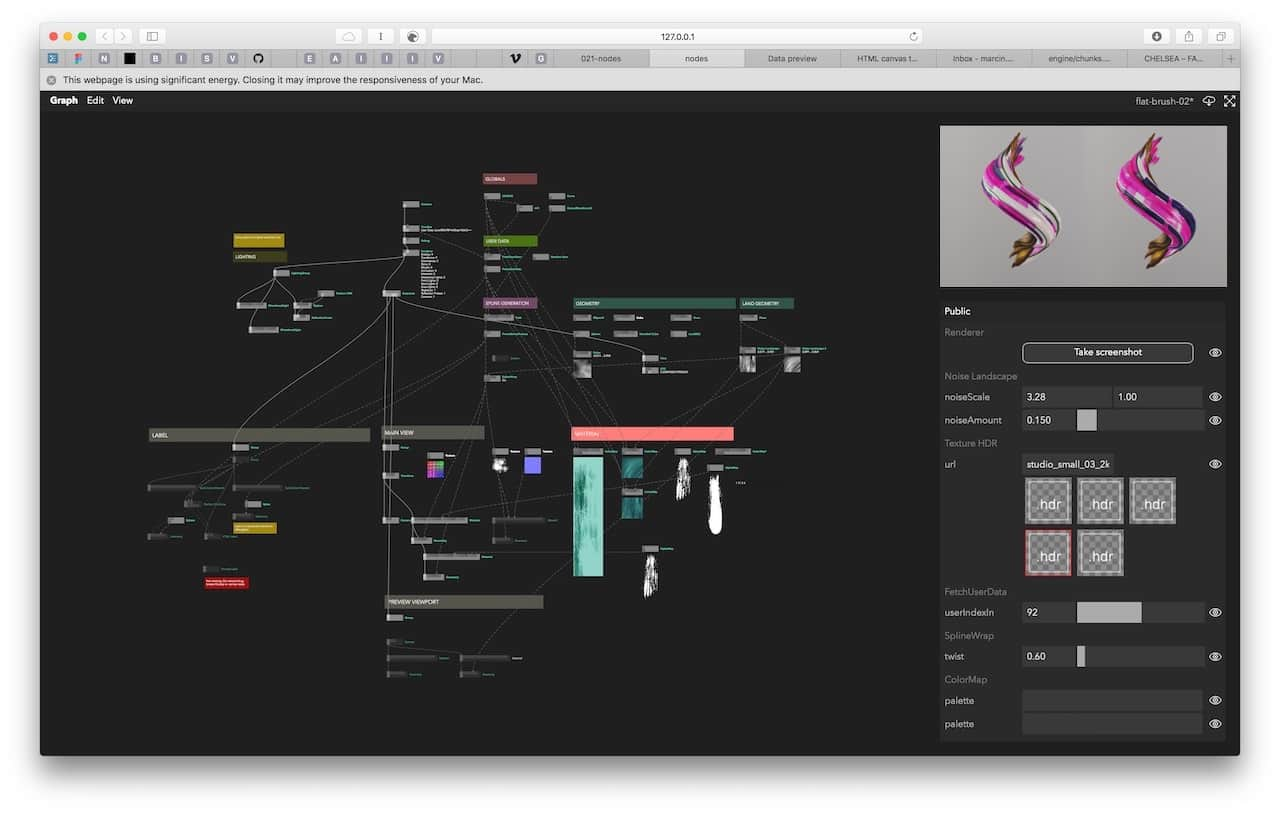
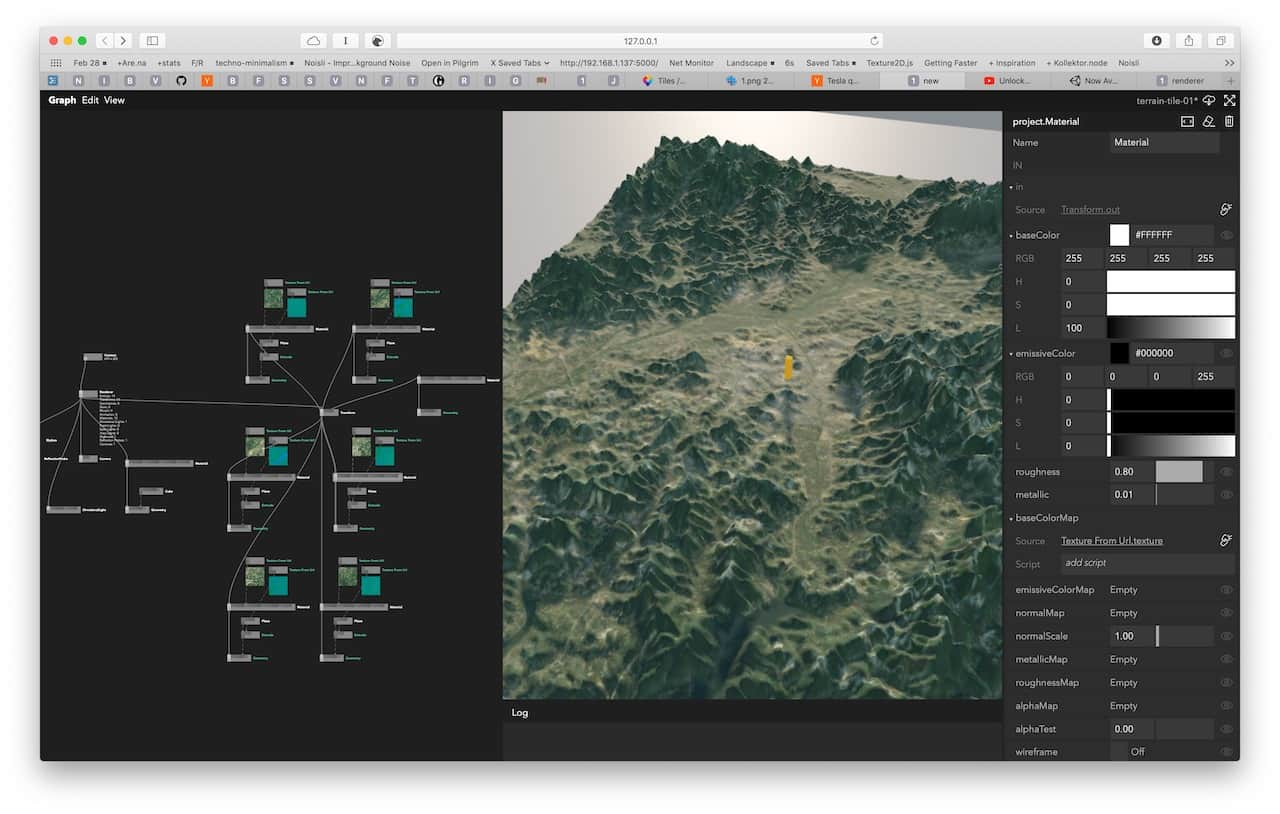
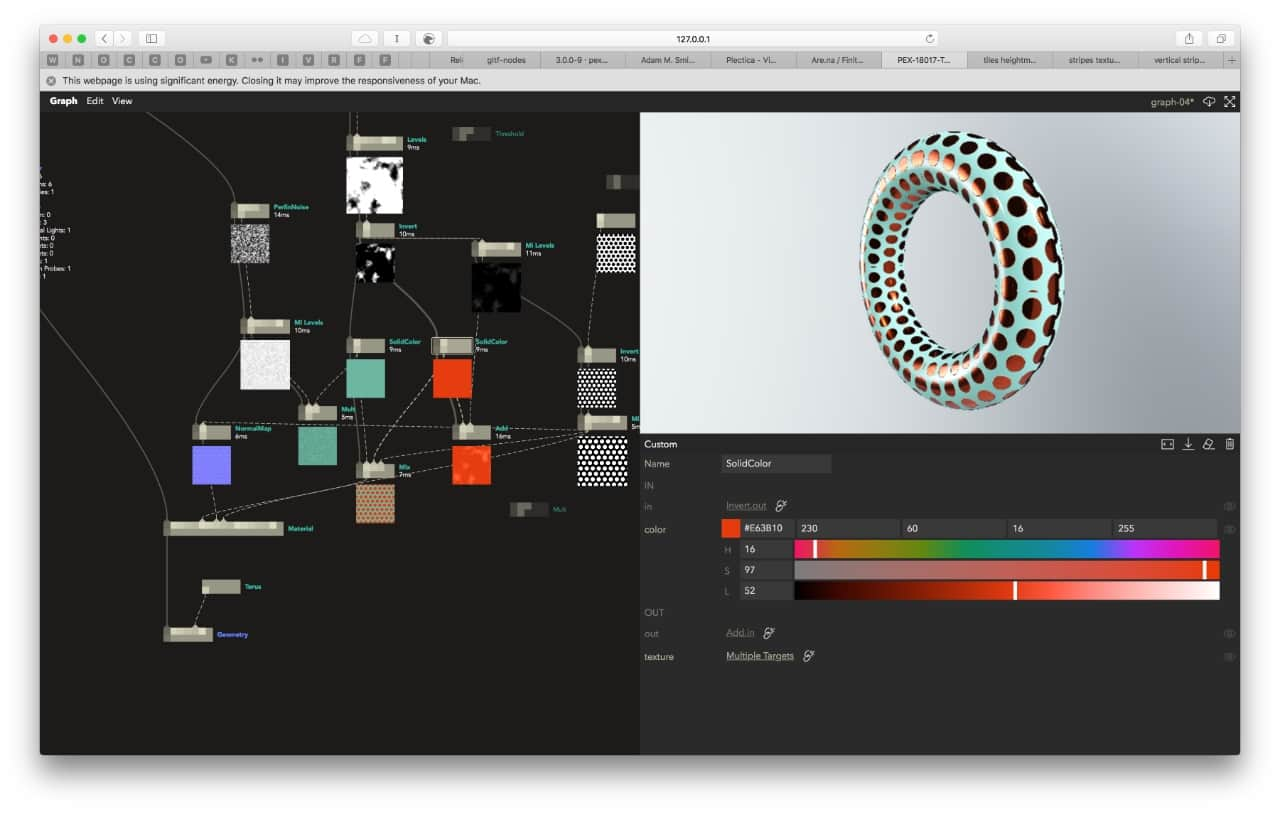
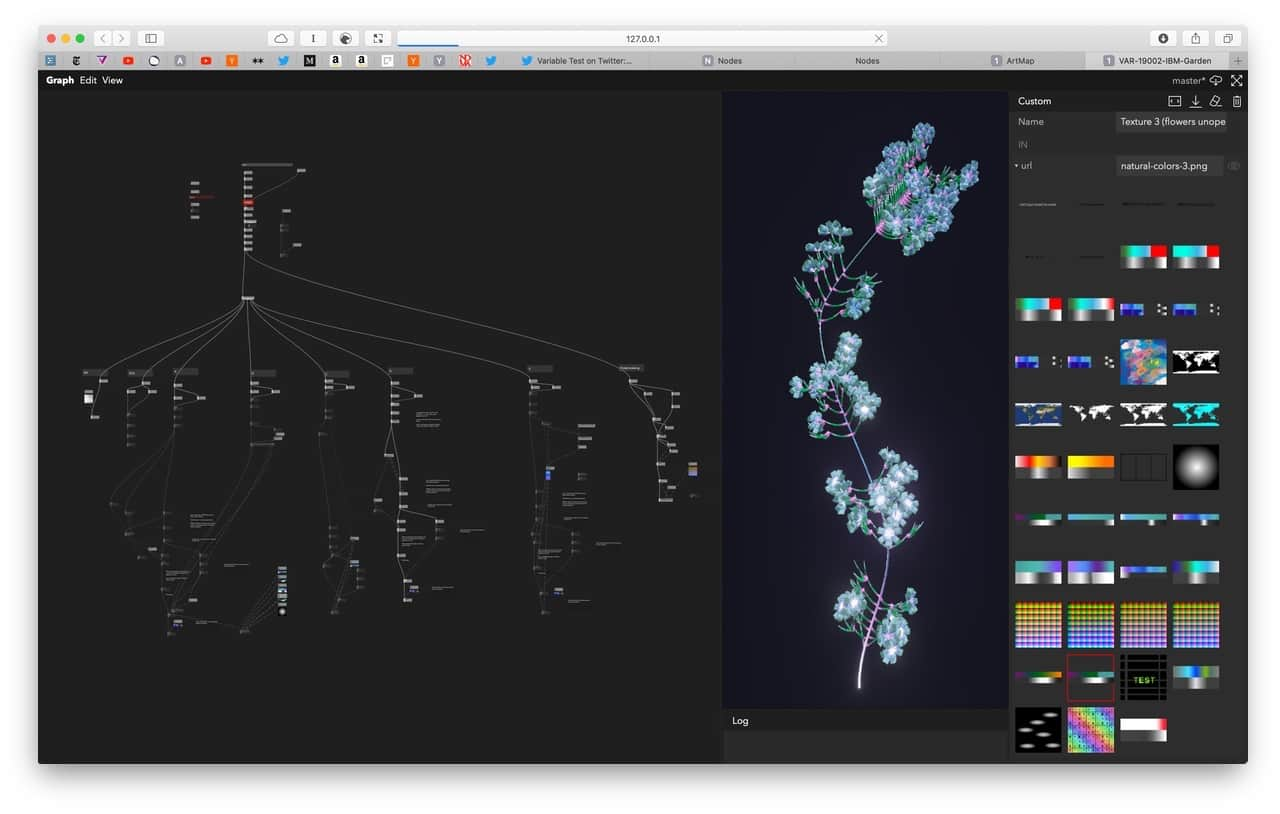
In the past 2 years, we have used Nodes for various types of projects and we have created output in multiple formats. Below is a list of possible use cases:
Learnings and Observations
Visual Literate Programming
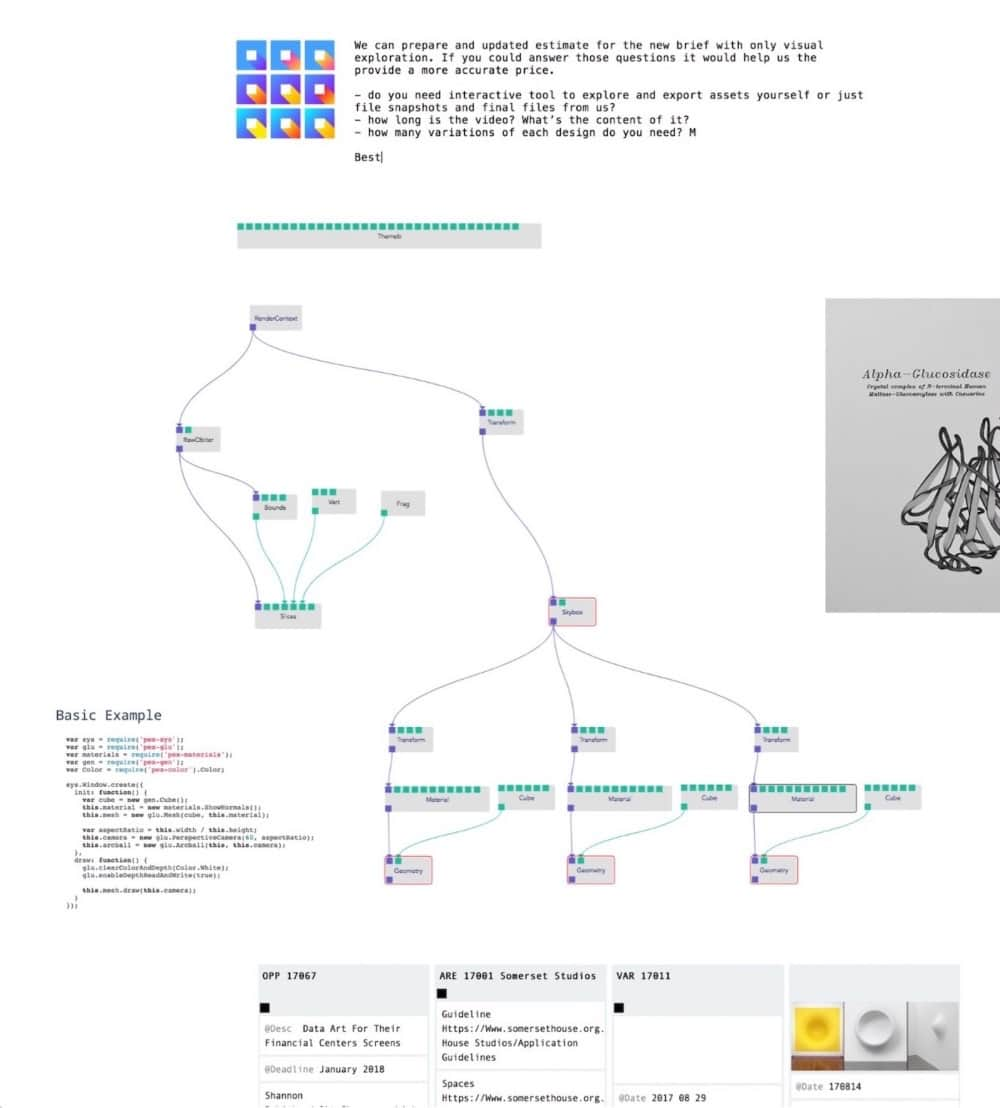
We noticed two things when working on bigger graphs and writing comments for our nodes.
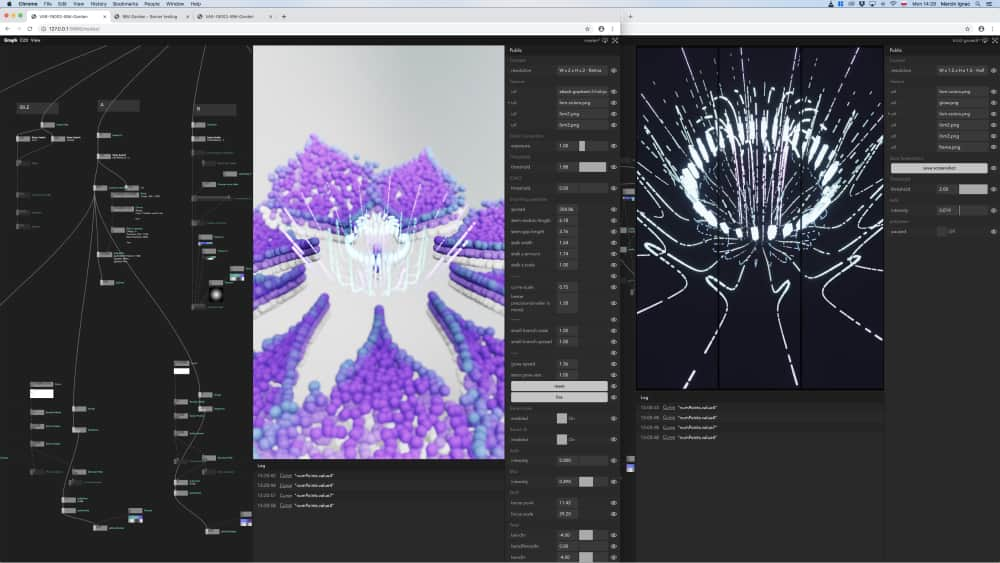
Firstly, the graph spatial layout encourages you to organise nodes in areas each responsible for distinct functionalities (e.g. data processing, geometry generation etc.) or part of a user flow (eg. different app screens). It’s an excellent way to get a broad overview of your application and explain it to a co-worker or a client before jumping into the code.
On bigger projects, it helps when coming back to an old graph where your brain is in need of a refresher on how it works. Normally, you would just have a bunch of text files and hopefully a README file. By creating empty nodes, giving them appropriate names, and writing comments in the graph view (not the code), you can also brainstorm the architecture of your app in the manner of UML or data-flow diagrams.
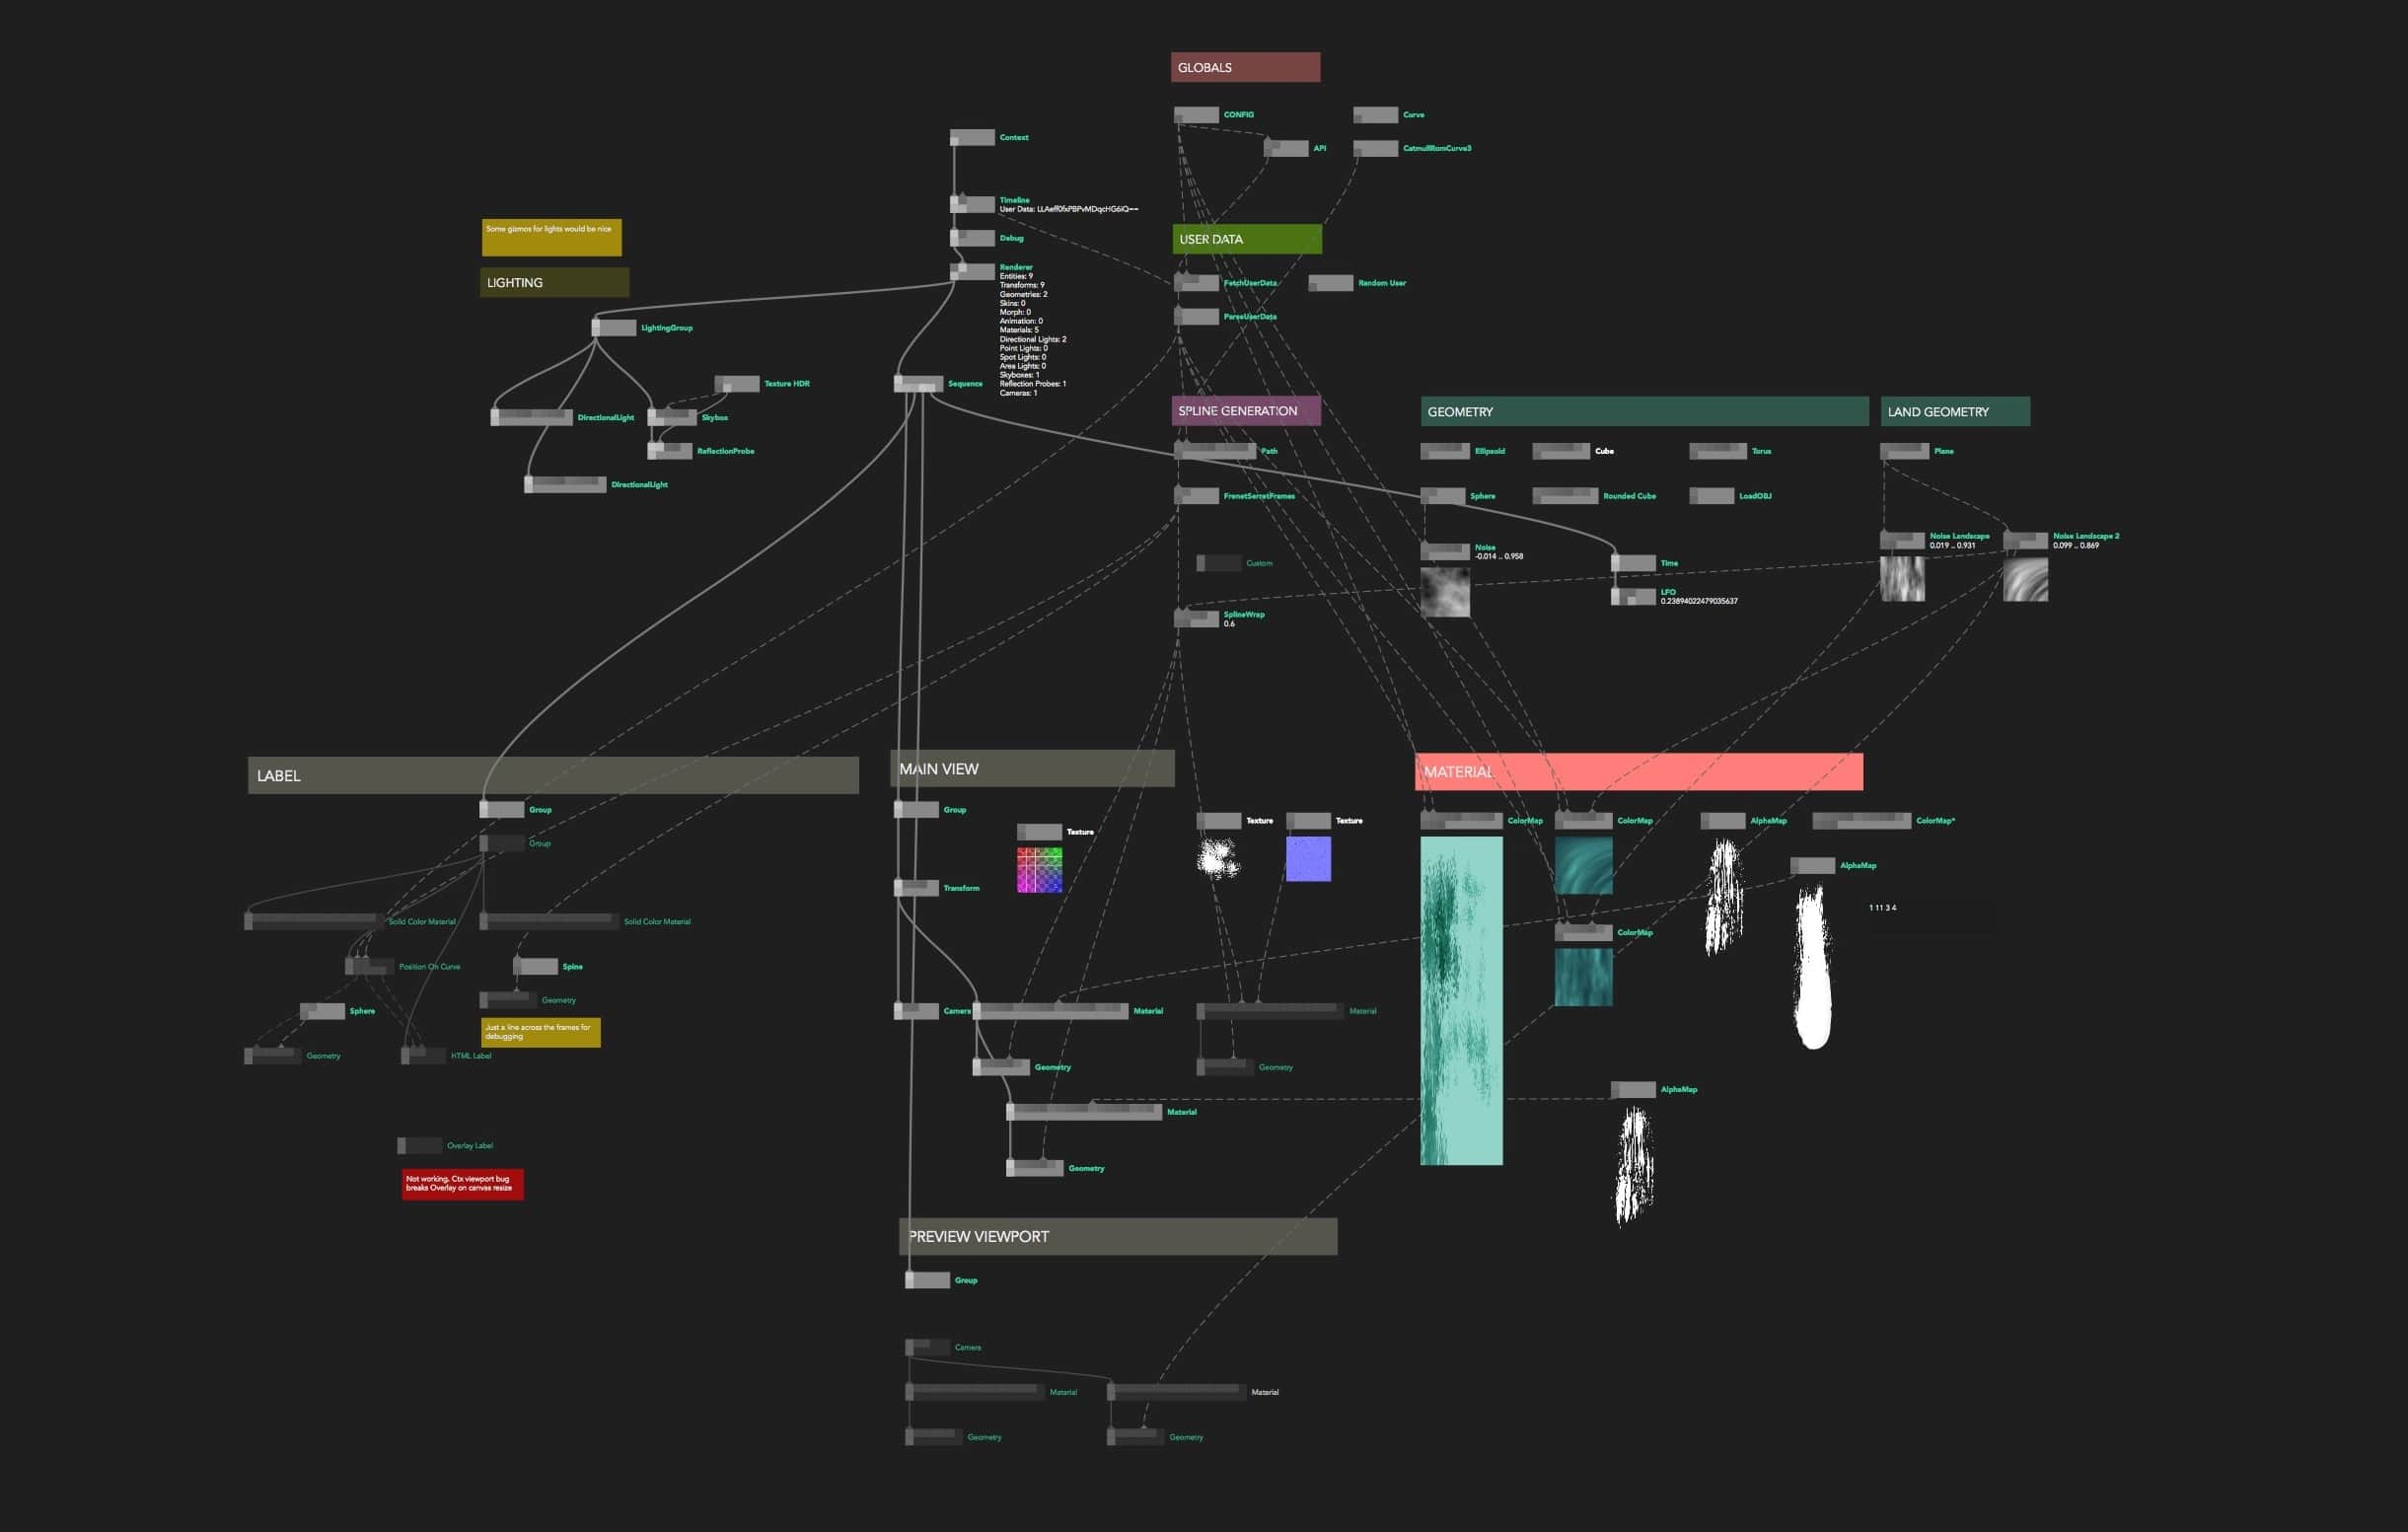
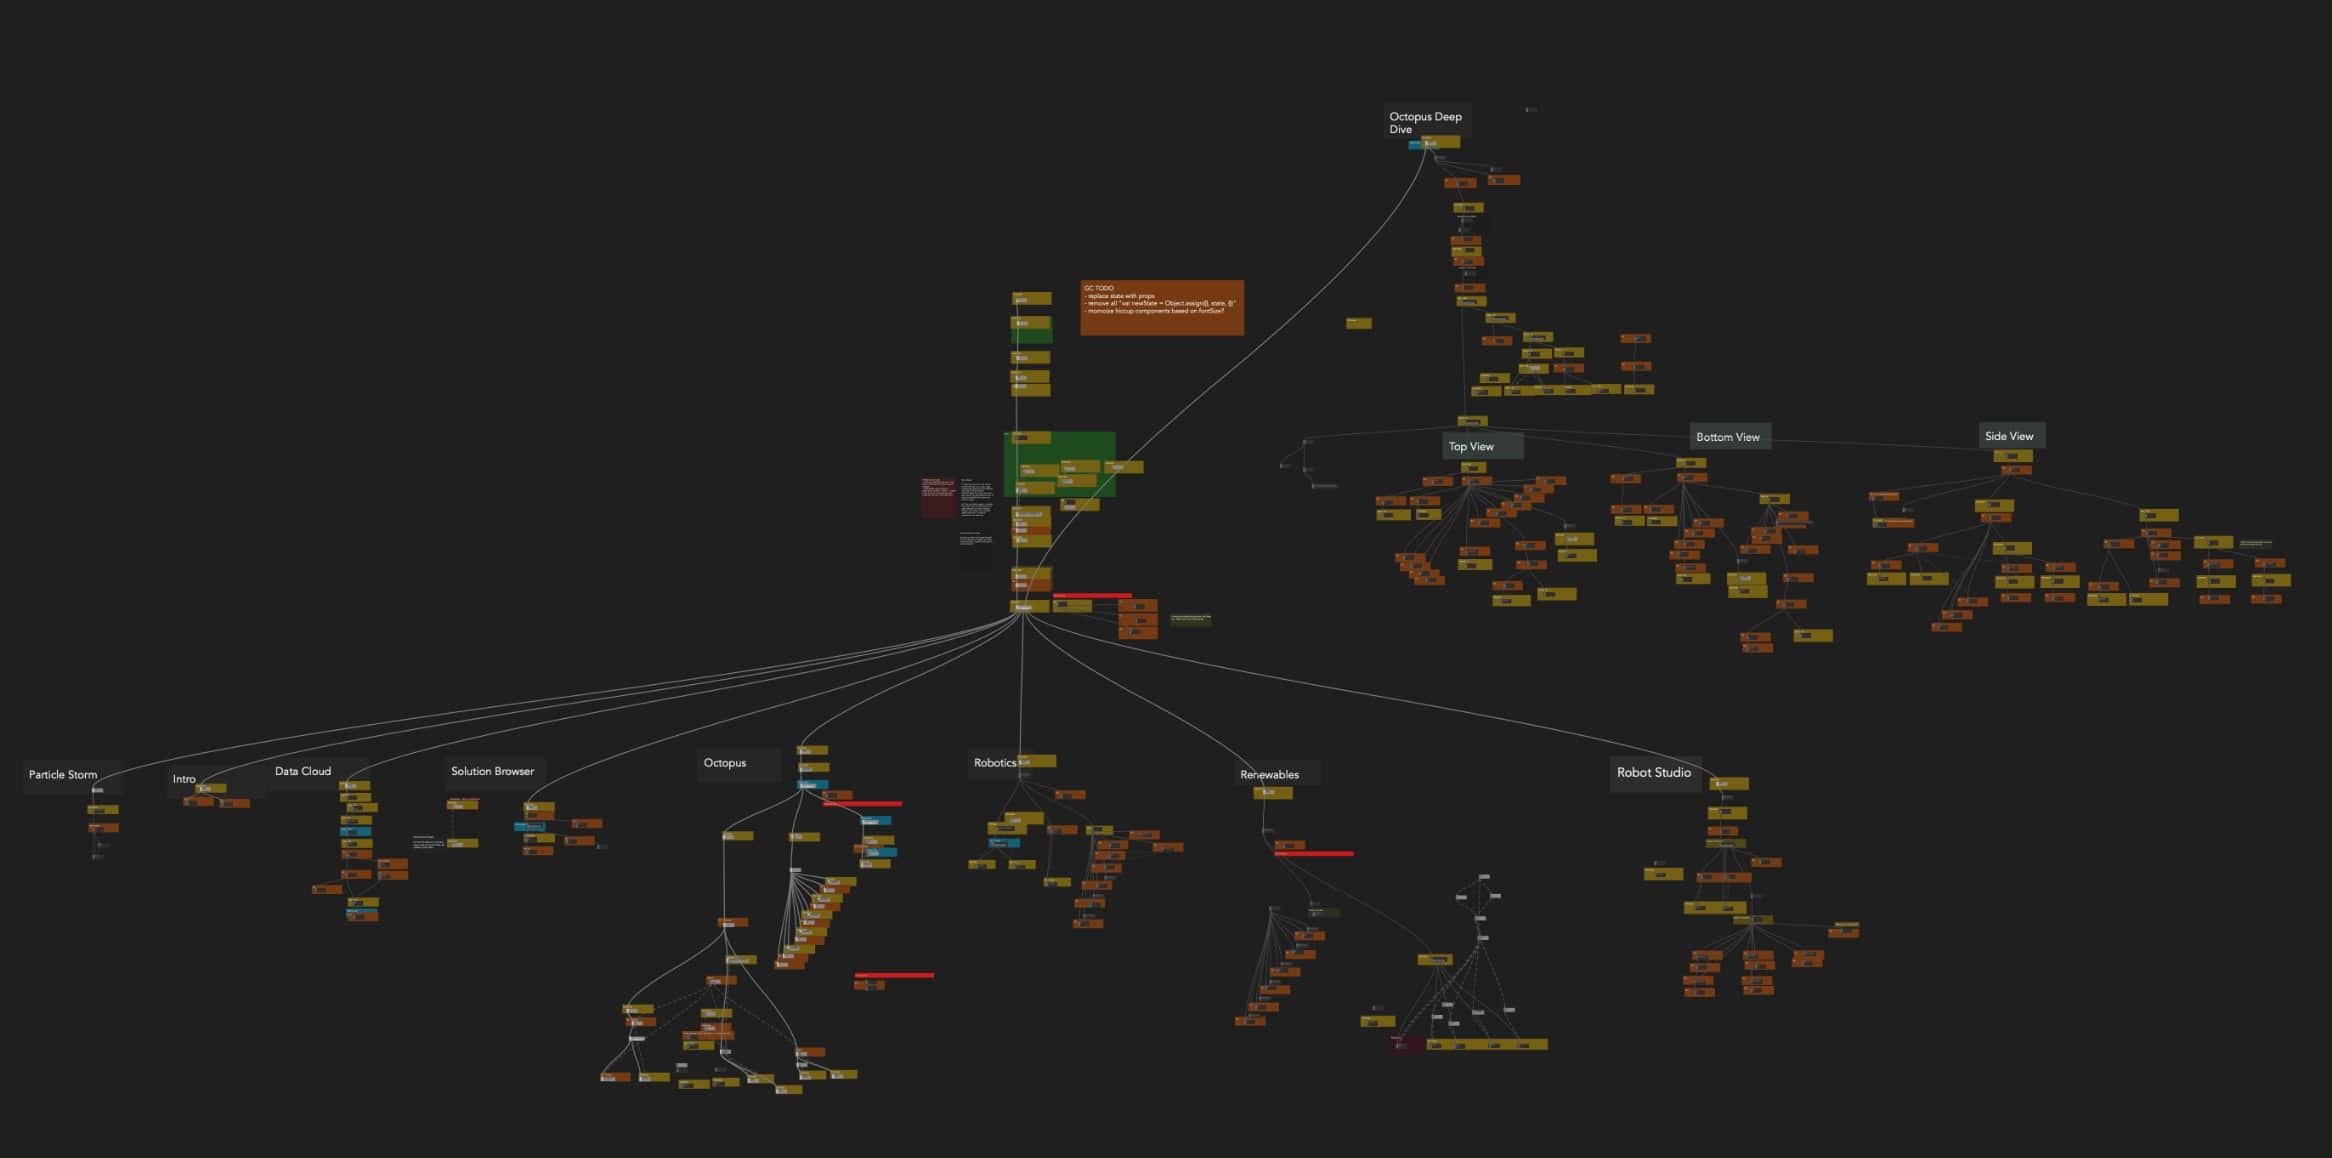
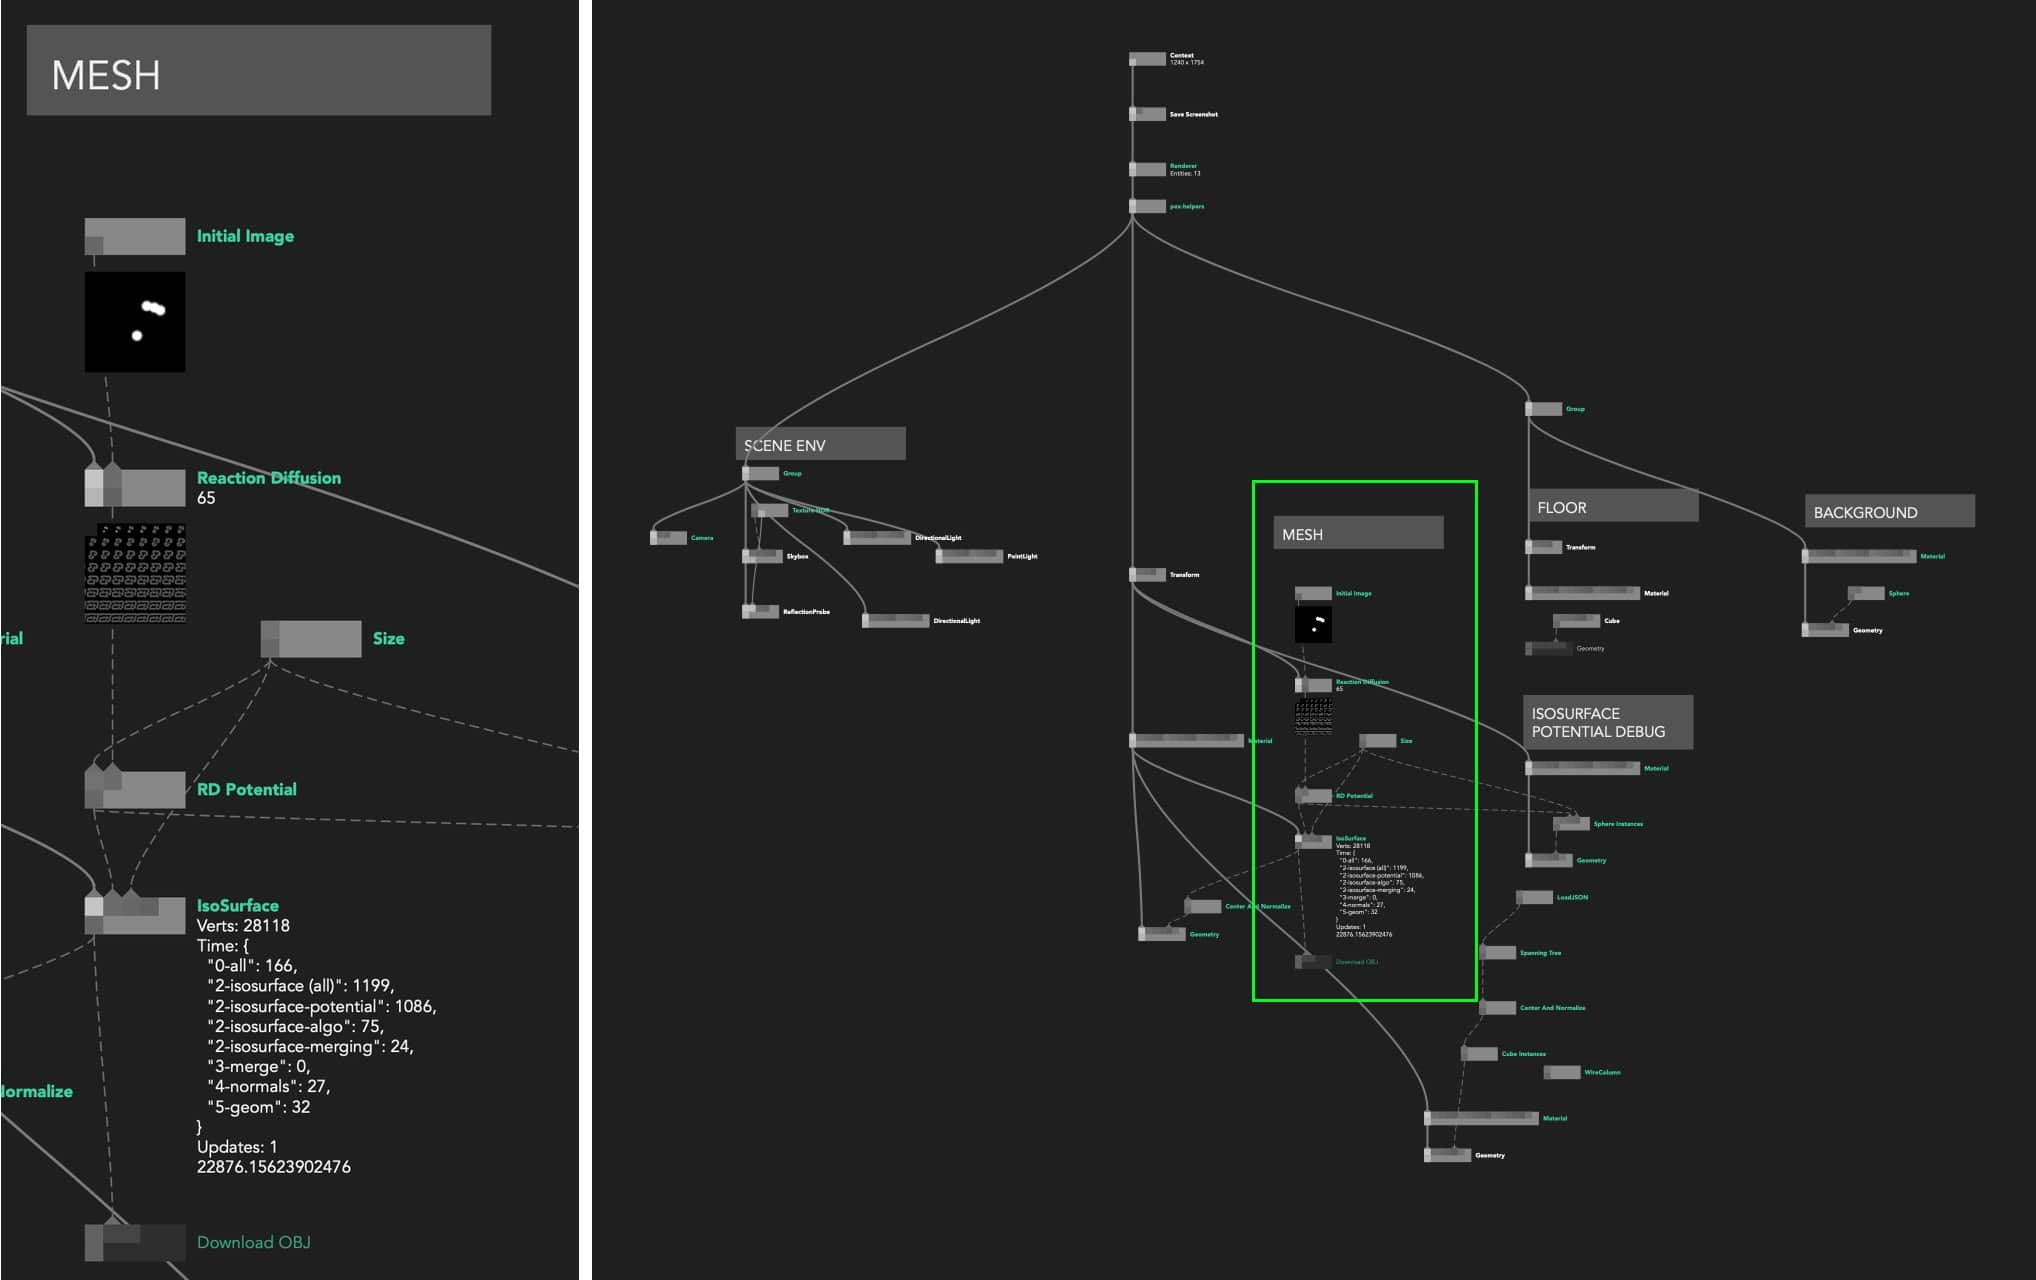
Secondly, as mentioned before, we naturally started including richer data in the node comments: text templates with live values, images and mini graphs. We use comments not only for debugging but also for visually scanning the graph as different parts of it become recognisable even on higher zoom levels. This allows you to quickly get a rough idea of what it’s doing. Our vision is to extend that functionality and have a true digital canvas with your graph, snippets of code, visualisations and references all in one place. Which brings us to…
Sketching In Code
Small changes in the ergonomics of your tool can amount to unlocking hidden creative powers.
Creative coding environments like Processing popularised the idea of “sketching in code”: quick and dirty prototyping allowing you to rapidly explore multiple ideas. This type of programming is especially suitable for visuals problems and early explorations where focusing too much on code structure and optimisation can slow us down and limit possibilities. If we compare this way of working to pen and paper sketching, the analogy breaks down quickly as we would be limited to draw only one thing per page. Having an explicit “edit, compile, run” loop (as opposed to surgical live changes) and no easy way to maintain multiple versions of the code (as opposed to quickly copy-pasting nodes or parts of the graph) usually hold you back from easily exploring multiple branches of your ideas.
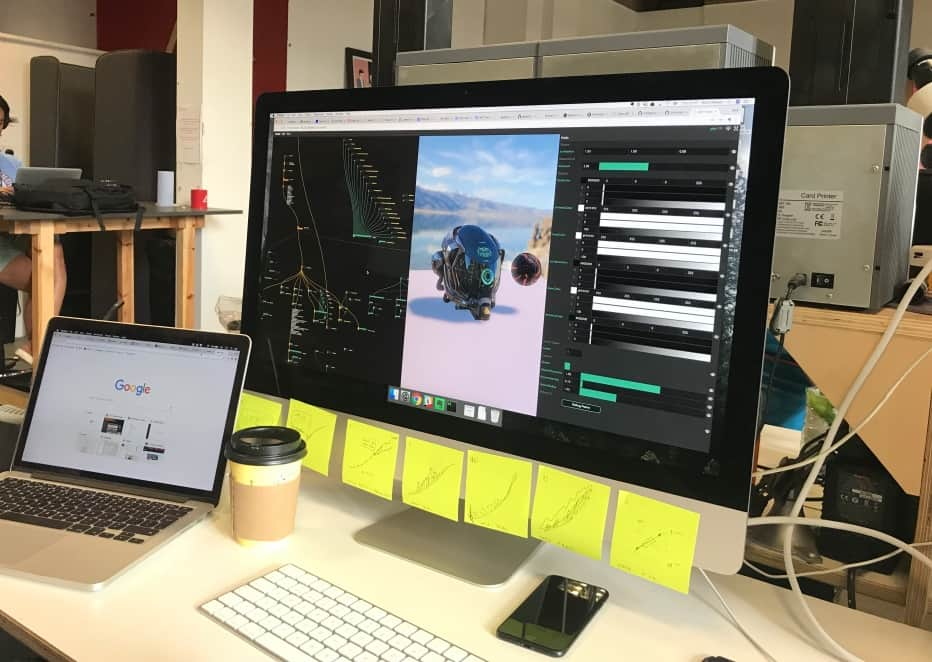
Nodes on the other hand allows you to not only edit code live but also run multiple branches of a graph at the same time e.g. 2D visualisation in d3.js, basic raw WebGL visualisation and full-blown 3D scenes with physically-based lighting using pex-renderer. Another good example would be to start with a particle system running on the CPU and later implement a GPGPU version while keeping the same input data and final rendering parts of the graph. Both versions could even run at the same time.
Programming in Nodes enables easy code decoupling and, with copy-pasting, “transplantation” of graph parts between projects (e.g. data parsing pipeline or lighting setup).
Appendix
Short history and evolution of the interface
We started off in February 2017 inspired by seeing the user interface of Cables.gl even before they launched into beta. We knew we wanted Nodes backed up by JavaScript code that can be added, modified and compiled instantly.
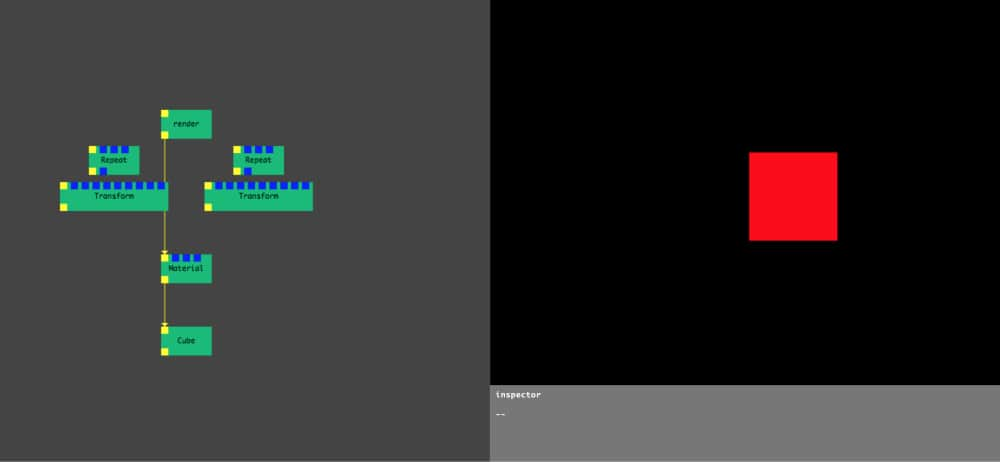
In July 2017, after 5 months of work (on what was back then still a side project for our studio), we could create nodes from templates, program new ones in the browser, live recompile them with Shift + Enter and see instant changes, expose and tweak their parameters and manually add npm modules to be required in their source code.
It was so much fun to use that we immediately started using it for prototyping in our commercial projects. Despite common crashes, sporadic data losses and UI quirks, the productivity gain was tremendous. See Learnings and Observations for more info on how our workflow has changed after adopting Nodes.
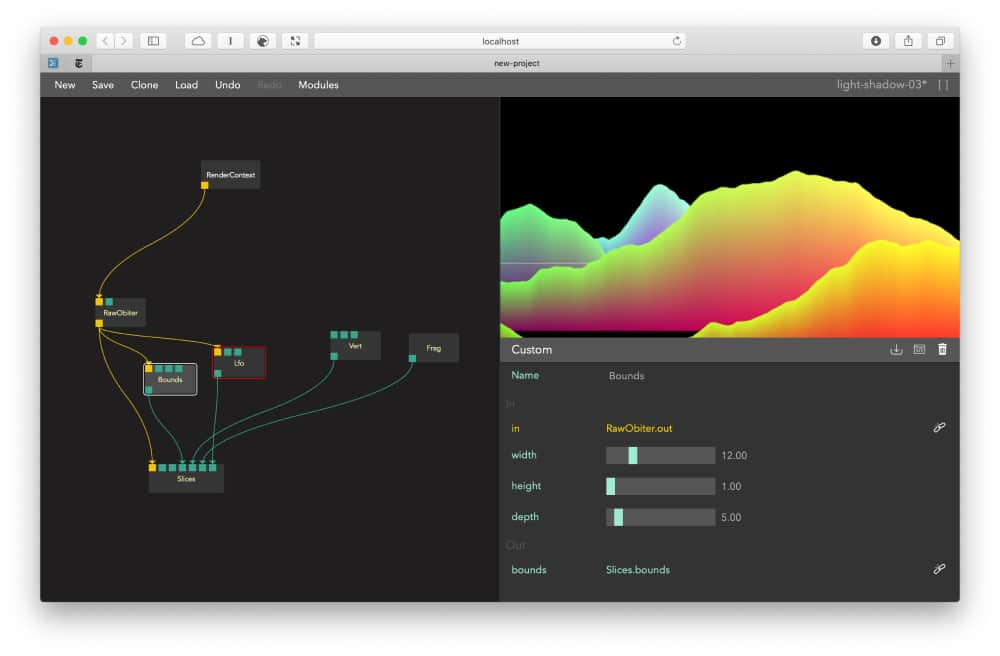
As our graphs grew, we experimented with breaking away from the columns and grid-based interface so common in content creation tools. Beside the appealing aesthetics, it proved to be only minor improvement from a UX point of view as you still need your code editor, inspector and preview to be visible and accessible.
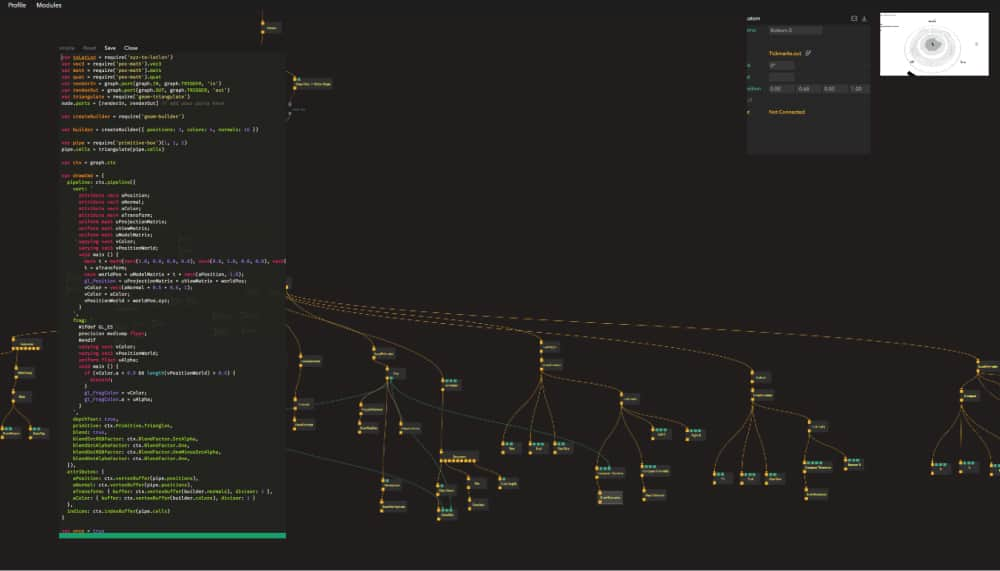
Data in our graphs flows from top to bottom; inputs are at the top of the node, outputs at the bottom and text labels in the middle. This way vertical space becomes very scarce. Borrowing some ideas from Houdini, we moved labels outside of the nodes to compress the graph vertically and remove constraints on the name length of the nodes. That layout allowed us to add node comments used to describe node behaviour but also peek at its internal state. We talk more about it in Visual literate programming section.
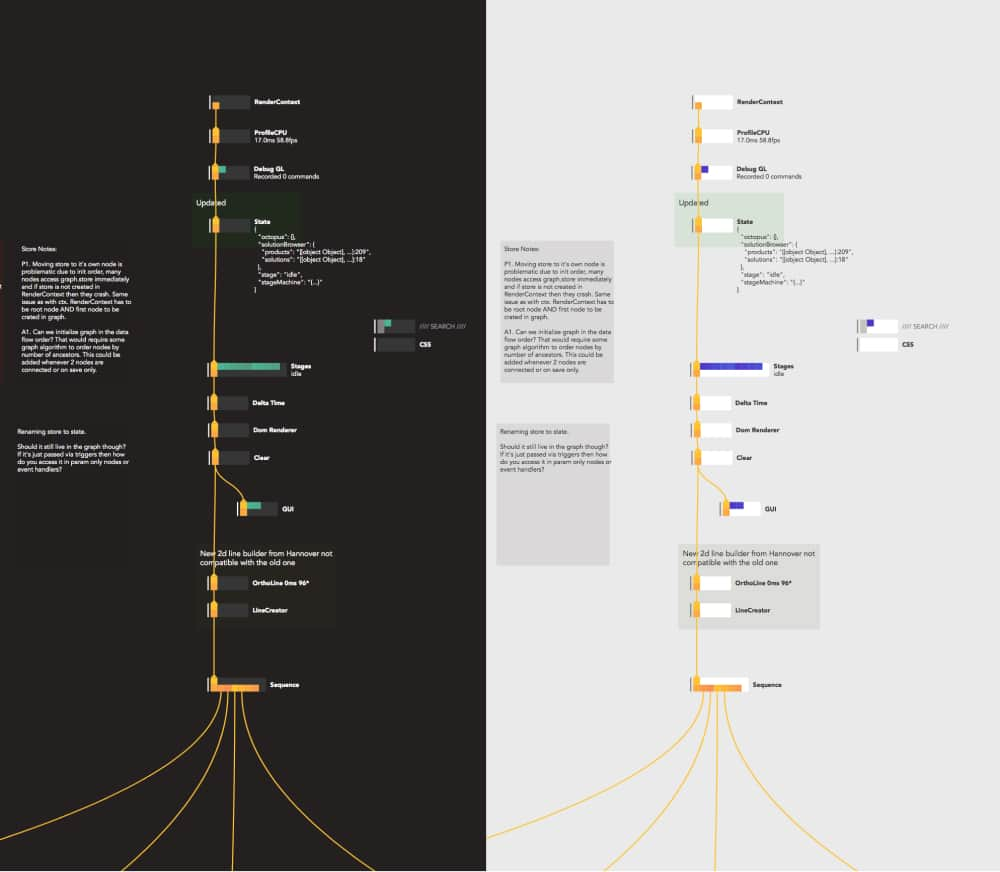
These are only few major iterations out of many more developed both in code and manually in Figma. You can see the whole journey in this Nodes Themes Figma Board or ui-evolution.pdf

Future
We keep using Nodes on a daily basis and actively work on making it better. After trying out a restricted alpha version with a group of various people and gathering feedback, we’ve released our beta version in the summer 2020 and will continue to work on improving Nodes for everyone.
Contact
If something is missing or if you found some part confusing, please file an issue with your suggestions for improvement, tweet at the @nodes_io account or simply drop up a line at hello@nodes.io.
